Early Downs and Field Zones: How Situation Shapes the Call

First down is football’s freest snap, second down sets the price of third, and where the ball sits on the field quietly rewrites the menu.

Show the Python (shared helpers for this chapter’s diagrams and charts)
import os
import shutil

import numpy as np
import pandas as pd
import matplotlib.pyplot as plt
from matplotlib.colors import LinearSegmentedColormap
from matplotlib.patches import Circle, Ellipse, FancyArrowPatch, Rectangle, RegularPolygon
from IPython.display import HTML, Markdown, display

from gridiron import Play, Player, Field, technique, style, FIELD_WIDTH

style.apply()
MINUS = "−"
PURPLE = style.SERIES[6]   # a ring colour that is neither offense blue nor defense orange
RED = style.SERIES[7]      # rings on the defender a play is built to punish
MID = FIELD_WIDTH / 2


def pdf_build():
    return os.environ.get("RTG_FORMAT", "").lower() in ("pdf", "typst", "print")


def pct(v, nd=0):
    return f"{100 * v:.{nd}f}%"


def signed(v, nd=2):
    """+1.23 / −0.45 with a real minus sign."""
    return f"{v:+.{nd}f}".replace("-", MINUS)


def ordinal(n):
    n = int(n)
    suf = "th" if 10 <= n % 100 <= 20 else {1: "st", 2: "nd", 3: "rd"}.get(n % 10, "th")
    return f"{n}{suf}"


def pts(v, nd=0):
    """A difference in percentage points: 0.134 -> '13'."""
    return f"{100 * v:.{nd}f}"


# ---- field zones, in yards from the opponent's goal line (nflverse `yardline_100`) ----------------
# backed up: own 1-10 | coming out: own 11-25 | open field: own 26 to opp 41 |
# four-down territory: opp 40-21 | red zone: opp 20 to goal
ZONES = [("backed up", 90, 100), ("coming out", 75, 90), ("open field", 40, 75),
         ("four-down\nterritory", 20, 40), ("red zone", 0, 20)]
ZONE_COL = {"backed up": style.DEFENSE, "coming out": style.LINE_TO_GAIN, "open field": style.OFFENSE,
            "four-down\nterritory": style.THIRD, "red zone": style.DEFENSE_DARK}


def zone_of(y100):
    for name, lo, hi in ZONES:
        if lo < y100 <= hi:
            return name.replace("\n", " ")
    return None


def shade_zones(ax, alpha=0.07, labels=True, y=None, fs=6.6):
    """Faint zone bands on a chart whose x axis is BDB x (own goal line 10, opponent's goal line 110)."""
    for name, lo, hi in ZONES:
        x0, x1 = 110 - hi, 110 - lo
        ax.axvspan(x0, x1, color=ZONE_COL[name], alpha=alpha, lw=0, zorder=0)
        if labels:
            ax.text((x0 + x1) / 2, y, name.upper().replace("\n", " ") if hi - lo > 18 else name.upper(),
                    ha="center", va="top", fontsize=fs, color=style.INK_2, fontweight="bold", linespacing=1.0,
                    zorder=1)


def yardline_axis(ax, fs=7):
    ax.set_xlim(10, 110)
    ax.set_xticks([10, 20, 30, 40, 50, 60, 70, 80, 90, 100, 110],
                  ["goal", "10", "20", "30", "40", "50", "40", "30", "20", "10", "goal"], fontsize=fs)


# ---- players and on-field labels (book conventions: offense circles, defense squares) -----------
def O(key, pos, d, w, label=None):
    return Player(key, pos, "off", d, w, label=key if label is None else label)


def D(key, pos, d, w, label=None):
    return Player(key, pos, "def", d, w, label=label)


def line():
    """Five offensive linemen; only the center labelled."""
    return [O(k, k, -0.7, w, "C" if k == "C" else "") for k, w in
            zip(["LT", "LG", "C", "RG", "RT"], (-3.2, -1.6, 0.0, 1.6, 3.2))]


def _P(fld, p, d, w):
    return fld.xy(*p.to_abs(d, w))


def say(fld, p, d, w, text, color=style.INK_2, fontsize=6.8, ha="center", weight="normal"):
    """A short on-field label at (d, w), on a light patch so lines don't run through it."""
    x, y = _P(fld, p, d, w)
    fld.ax.text(float(x), float(y), text, fontsize=fontsize, color=color, ha=ha, va="center", zorder=11,
                fontweight=weight, linespacing=1.1,
                bbox=dict(boxstyle="round,pad=0.18", fc=style.SURFACE, ec="none", alpha=0.92))


def point_to(fld, p, text_at, target, text, color=style.INK_2, fontsize=6.6):
    """A label with a thin leader line to the player or spot it names."""
    (xt, yt), (xp, yp) = _P(fld, p, *text_at), _P(fld, p, *target)
    fld.ax.annotate(text, (float(xp), float(yp)), xytext=(float(xt), float(yt)), fontsize=fontsize,
                    color=color, ha="center", va="center", zorder=11, linespacing=1.1,
                    arrowprops=dict(arrowstyle="-", color=color, lw=0.7, shrinkA=2, shrinkB=7),
                    bbox=dict(boxstyle="round,pad=0.18", fc=style.SURFACE, ec="none", alpha=0.92))


def clean(ax):
    """Zoomed diagrams: drop the tiny hash ticks and painted yard numbers, clip text to the window."""
    for ln in list(ax.lines):
        xs, ys = ln.get_data()
        if len(xs) == 2 and ln.get_linewidth() == 0.5 and np.hypot(xs[1] - xs[0], ys[1] - ys[0]) < 1.0:
            ln.remove()
    for t in list(ax.texts):
        if t.get_text().isdigit() and t.get_alpha() == 0.55:
            t.remove()
        else:
            t.set_clip_on(True)


def draw(p, ax=None, width_in=5.8, **kw):
    fld = p.draw(ax=ax, width_in=width_in, title=False, **kw)
    clean(fld.ax)
    return fld


def panel_title(ax, text, fontsize=8.6):
    ax.set_title(text, fontsize=fontsize, loc="left", color=style.INK, fontweight="bold", pad=3)


def end_zone_marks(fld, p, w_text, goal_d, label_goal=True):
    """Label the goal line and end line on a backed-up diagram (goal_d = goal line's depth from the LOS)."""
    say(fld, p, goal_d - 5.0, w_text, "OWN\nEND ZONE", color=style.INK_2, fontsize=6.4, weight="bold")
    if label_goal:
        say(fld, p, goal_d + 0.0, -w_text, "goal line", fontsize=6.0)


# ---- frame strips (print) and videos (web) for simulated plays --------------------------------
MARK_R = 0.95   # frame-strip marker radius in yards


def tracking(play):
    df = play.to_tracking()
    df["_id"] = df["displayName"].astype(str)
    return df


def panel(ax, play, df, t, lateral, window, rings=()):
    """One moment of a simulated play: markers, trails of on-screen players, rings."""
    tmap = df.groupby("frameId")["time"].first()
    fid = int((tmap - t).abs().idxmin())
    ylo, yhi = sorted((play.ball_y - lateral[0], play.ball_y - lateral[1]))
    fld = Field(ax=ax, orient="vertical", los=play.los, window=window, numbers=False, hashes=False,
                lateral=(ylo, yhi), to_go=play.to_go)
    cur = df[df["frameId"] == fid]
    shown = cur[cur["x"].between(play.los + window[0] + 0.4, play.los + window[1] - 0.4)
                & cur["y"].between(ylo + 0.4, yhi - 0.4)]
    ids = set(shown["_id"])
    trails = df[(df["frameId"] <= fid) & df["_id"].isin(ids) & (df["side"] != "ball")]
    for (_, side), g in trails.groupby(["_id", "side"]):
        xs, ys = fld.xy(g["x"].values, g["y"].values)
        ax.plot(xs, ys, color=style.OFFENSE if side == "off" else style.DEFENSE, lw=0.9, alpha=0.4, zorder=3)
    ppy = fld.pts_per_yard()
    for _, rr in shown.iterrows():
        x, y = (float(v) for v in fld.xy(rr["x"], rr["y"]))
        if rr["side"] == "ball":
            # a carried ball sits beside its carrier so it never covers his letter
            near = cur[cur["side"] != "ball"]
            held = (np.hypot(near["x"] - rr["x"], near["y"] - rr["y"]) < 1.2).any()
            bx, by = (x + MARK_R * 1.25, y + MARK_R * 0.55) if held else (x, y)
            ax.add_patch(Ellipse((bx, by), 0.7, 0.42, fc=style.BALL, ec="white", lw=0.5, zorder=9))
            continue
        lab = str(rr.get("label", "") or "")
        if rr["side"] == "off":
            ax.add_patch(Circle((x, y), MARK_R, fc=style.OFFENSE, ec="white", lw=0.6, zorder=8))
            tc = "white"
        else:
            ax.add_patch(RegularPolygon((x, y), 4, radius=MARK_R * 1.3, orientation=np.pi / 4,
                                        fc=style.DEFENSE_TINT, ec=style.DEFENSE, lw=1.0, zorder=8))
            tc = style.INK
        fs = max(4.0, min(8.0, ppy * (1.1 if len(lab) <= 1 else 0.85)))
        ax.text(x, y, lab, ha="center", va="center", fontsize=fs, color=tc, fontweight="bold", zorder=10)
    for key, col in rings:
        rr = cur[cur["displayName"] == key].iloc[0]
        x, y = fld.xy(rr["x"], rr["y"])
        ax.add_patch(Circle((float(x), float(y)), MARK_R * 1.55, fc="none", ec=col, lw=1.7, zorder=7))
    # the throw: a dashed brown line from where it was released to where the ball is now
    for kind, _, te in play.ball_events:
        if kind == "pass" and t > te:
            (d0, w0) = play.ball_position(te)
            (d1, w1) = play.ball_position(t)
            xs, ys = fld.xy(*play.to_abs(np.array([d0, d1]), np.array([w0, w1])))
            ax.plot(xs, ys, color=style.BALL, lw=1.3, ls=(0, (2.5, 1.8)), zorder=6)
    return fld


def strip(play, times, notes, lateral, window, ncols=2, rings=(), width_in=6.4):
    """Numbered, captioned frame strip: the PDF stand-in for the video."""
    df = tracking(play)
    nrows = int(np.ceil(len(times) / ncols))
    pw = width_in / ncols
    span_w, span_d = lateral[1] - lateral[0], window[1] - window[0]
    fig, axes = plt.subplots(nrows, ncols, squeeze=False,
                             figsize=(width_in, nrows * (pw * span_d / span_w + 0.55)))
    for ax in axes.flat[len(times):]:
        ax.axis("off")
    for i, (ax, t) in enumerate(zip(axes.flat, times)):
        panel(ax, play, df, t, lateral, window, rings)
        ax.set_title(f"{i + 1}.  " + ("snap" if abs(t) < 1e-6 else f"{t:+.1f} s"), fontsize=8.5,
                     color=style.INK_2, loc="left")
        ax.text(0.5, -0.03, notes[i], transform=ax.transAxes, ha="center", va="top", fontsize=7.5,
                color=style.INK, linespacing=1.15)
    fig.tight_layout(h_pad=1.6, w_pad=0.6)
    return fig


def video(play, times, notes, lateral, window, rings=(), width_in=5.6):
    """Web version of the strip: every frame, with the strip's notes as running captions."""
    from matplotlib import animation
    df = tracking(play)
    span_w, span_d = lateral[1] - lateral[0], window[1] - window[0]
    fig, ax = plt.subplots(figsize=(width_in, width_in * span_d / span_w + 0.4))
    tmap = df.groupby("frameId")["time"].first()

    def update(fid):
        ax.clear()
        t = float(tmap[fid])
        panel(ax, play, df, t, lateral, window, rings)
        cur = [n.replace("\n", " ") for tt, n in zip(times, notes) if tt <= t + 1e-6]
        ax.set_title(("snap" if abs(t) < 0.05 else f"{t:+.1f} s") + (("   " + cur[-1]) if cur else ""),
                     fontsize=8.0, color=style.INK, loc="left")
        return []

    anim = animation.FuncAnimation(fig, update, frames=sorted(df["frameId"].unique()), interval=100)
    html = (anim.to_html5_video(embed_limit=40).replace("<video ", '<video style="max-width:100%;height:auto" ')
            if shutil.which("ffmpeg") else anim.to_jshtml(default_mode="once"))
    plt.close(fig)
    display(HTML(html))


def animation_or_strip(play, times, notes, lateral, window, rings=(), ncols=2):
    """Video on the website; a numbered, captioned frame strip in the PDF."""
    if pdf_build():
        strip(play, times, notes, lateral, window, ncols=ncols, rings=rings)
        plt.show()
    else:
        video(play, times, notes, lateral, window, rings=rings)
Show the Python (load 1999-2025 play-by-play and compute the numbers quoted in the text)
from gridiron.data import pbp, nfl

COLS = ["season", "season_type", "game_id", "play_id", "posteam", "home_team", "result", "drive", "qtr",
        "down", "ydstogo", "yardline_100", "goal_to_go", "play_type", "pass", "sack", "shotgun", "qb_dropback",
        "epa", "ep", "success", "first_down", "series_success", "wp", "half_seconds_remaining", "air_yards",
        "incomplete_pass", "yards_gained", "safety", "interception", "fumble_lost", "field_goal_result",
        "kick_distance"]
raw = pbp(list(range(1999, 2026)), columns=COLS)
reg = raw[raw.season_type == "REG"]
snaps = reg[reg.play_type.isin(["pass", "run"]) & reg.down.notna()].sort_values(["game_id", "play_id"]).copy()
# what happened on the previous snap of the same drive (for the second-down tendency)
prev = snaps.groupby(["game_id", "drive"])
snaps["prev_down"] = prev["down"].shift(1)
snaps["prev_inc"] = prev["incomplete_pass"].shift(1)
snaps["prev_type"] = prev["play_type"].shift(1)
# neutral situations: outside the last two minutes of each half, win probability 20-80%
neutral = snaps[(snaps.half_seconds_remaining > 120) & snaps.wp.between(0.2, 0.8)].copy()
N5 = neutral[neutral.season.between(2021, 2025)]          # the last five seasons
N10 = neutral[neutral.season.between(2016, 2025)]         # the last ten seasons
S = {}  # numbers quoted in the text

# ---- first down over time
F10 = neutral[(neutral.down == 1) & (neutral.ydstogo == 10)]
TREND = F10.groupby("season")["pass"].mean()
TREND2 = neutral[neutral.down == 2].groupby("season")["pass"].mean()
GAP = F10.groupby(["season", "pass"]).epa.mean().unstack()
GAP["gap"] = GAP[1] - GAP[0]
S["f10_lo"], S["f10_hi"], S["f10_25"] = TREND.min(), TREND.max(), TREND.loc[2025]
S["p2_99"], S["p2_25"] = TREND2.loc[1999:2003].mean(), TREND2.loc[2021:2025].mean()
S["gap_lo"], S["gap_hi"] = GAP.gap.min(), GAP.gap.max()
# did the 2018 offenses move the league? first-and-10 pass rate in 2018 and every season since
S["f10_18"], S["f10_after_max"] = TREND.loc[2018], TREND.loc[2019:2025].max()
S["f10_18_top"] = TREND.loc[2016:2025].idxmax() == 2018

# ---- on schedule: how a first-and-10 play sets up the rest of the series (2016-2025, own 20 to opp 30)
OS = N10[(N10.down == 1) & (N10.ydstogo == 10) & N10.yardline_100.between(30, 80)
         & (N10.interception == 0) & (N10.fumble_lost == 0) & N10.series_success.notna()].copy()
OS["g"] = np.where(OS.yards_gained < 0, -1, OS.yards_gained.clip(upper=10)).astype(int)
SCHED = OS.groupby("g").agg(succ=("series_success", "mean"), n=("series_success", "size"))
S["sched_loss"], S["sched_0"] = SCHED.loc[-1, "succ"], SCHED.loc[0, "succ"]
S["sched_4"], S["sched_3"] = SCHED.loc[4, "succ"], SCHED.loc[3, "succ"]
S["share_loss"] = SCHED.loc[-1, "n"] / SCHED.n.sum()
# the yardage that breaks even in EPA on first-and-10 (as in 01-02)
be = OS.groupby("g").epa.mean()
S["be_1_10"] = int(be[(be > 0) & (be.index >= 0)].index.min())

# ---- "establish the run": rushing attempts and winning, team-games 2016-2025
tg = reg[reg.season.between(2016, 2025) & reg.play_type.isin(["pass", "run"]) & reg.down.notna()].copy()
tg["early_h1"] = (tg.qtr <= 2) & (tg.down <= 2)
tg["is_run"] = tg["pass"] == 0
games = (tg.groupby(["game_id", "posteam"])
         .apply(lambda g: pd.Series({"runs": g.is_run.sum(), "h1_run": g.loc[g.early_h1, "is_run"].mean(),
                                     "q4_run": g.loc[g.qtr == 4, "is_run"].mean()}), include_groups=False)
         .reset_index())
gm = reg.drop_duplicates("game_id")[["game_id", "home_team", "result"]]
games = games.merge(gm, on="game_id")
games = games[games.result != 0]
games["won"] = ((games.posteam == games.home_team) == (games.result > 0)).astype(float)
S["c_runs"], S["c_h1"], S["c_q4"] = games.runs.corr(games.won), games.h1_run.corr(games.won), games.q4_run.corr(games.won)
S["n_games"] = len(games)
RUN_BINS = [0, 15, 20, 25, 30, 35, 80]
RUN_LABS = ["15 or\nfewer", "16–20", "21–25", "26–30", "31–35", "36+"]
games["rb"] = pd.cut(games.runs, RUN_BINS, labels=RUN_LABS)
WIN_RUNS = games.groupby("rb", observed=True).won.agg(["mean", "size"])
games["hb"] = pd.qcut(games.h1_run, 5, labels=["lowest\nfifth", "2nd", "3rd", "4th", "highest\nfifth"])
WIN_H1 = games.groupby("hb", observed=True).won.agg(["mean", "size"])
HB_EDGES = games.groupby("hb", observed=True).h1_run.agg(["min", "max"])
S["w30"] = games[games.runs > 30].won.mean()
S["w20"] = games[games.runs <= 20].won.mean()
# do runs get better as the defense "wears down"? early-down runs in close games, by quarter
QRUN = N10[(N10.down <= 2) & (N10["pass"] == 0)].groupby("qtr").epa.mean()
QPASS = N10[(N10.down <= 2) & (N10["pass"] == 1)].groupby("qtr").epa.mean()

# ---- team-seasons on early downs, 2016-2025
ED = N10[N10.down <= 2]
TEAM = ED.groupby(["season", "posteam"]).agg(pr=("pass", "mean"), epa=("epa", "mean"), n=("pass", "size"))
TEAM["run_epa"] = ED[ED["pass"] == 0].groupby(["season", "posteam"]).epa.mean()
TEAM["pass_epa"] = ED[ED["pass"] == 1].groupby(["season", "posteam"]).epa.mean()
for c in ["pr", "epa", "run_epa", "pass_epa"]:
    TEAM[c + "_rk"] = TEAM.groupby(level=0)[c].rank(ascending=False).astype(int)
S["c_team"] = TEAM.pr.corr(TEAM.epa)
CASES = {(2018, "KC"): "Chiefs 2018", (2018, "LA"): "Rams 2018", (2019, "BAL"): "Ravens 2019",
         (2023, "DET"): "Lions 2023", (2024, "DET"): "Lions 2024"}

# ---- second down by bucket, 2021-2025
SB = ["short (1–3)", "medium (4–6)", "long (7–10)", "very long (11+)"]
s2 = N5[N5.down == 2].copy()
s2["b"] = pd.cut(s2.ydstogo, [0, 3, 6, 10, 99], labels=SB)
SEC = s2.groupby("b", observed=True).agg(pr=("pass", "mean"), n=("pass", "size"))
SEC_EPA = s2.groupby(["b", "pass"], observed=True).epa.mean().unstack()
SEC_FD = s2.groupby(["b", "pass"], observed=True).first_down.mean().unstack()
att = s2[(s2["pass"] == 1) & s2.air_yards.notna()].copy()
att["deep"] = att.air_yards >= 15
DEEP = att.groupby(["b", "deep"], observed=True).epa.agg(["mean", "size"])
S["deep_share_2s"] = DEEP.loc[(SB[0], True), "size"] / SEC.loc[SB[0], "n"]
S["deep_epa_2s"] = DEEP.loc[(SB[0], True), "mean"]
S["short_epa_2s"] = DEEP.loc[(SB[0], False), "mean"]
S["n_deep_2s"] = int(DEEP.loc[(SB[0], True), "size"])
S["run_epa_2s"] = SEC_EPA.loc[SB[0], 0]
S["run_2_1"] = 1 - N5[(N5.down == 2) & (N5.ydstogo == 1)]["pass"].mean()
# why teams still run there: how often the run moved the chains on the spot
S["run_fd_2s"] = SEC_FD.loc[SB[0], 0]
S["run_fd_2_1"] = s2[(s2.ydstogo == 1) & (s2["pass"] == 0)].first_down.mean()
# play-action share of second-down passes (FTN charting, 2022-2025)
ftn = nfl().load_ftn_charting([2022, 2023, 2024, 2025]).to_pandas()[
    ["nflverse_game_id", "nflverse_play_id", "is_play_action"]]
s2f = s2[(s2.season >= 2022) & (s2["pass"] == 1)].merge(
    ftn, left_on=["game_id", "play_id"], right_on=["nflverse_game_id", "nflverse_play_id"], how="left")
s2f = s2f[s2f.is_play_action.notna()]
PA2 = s2f.groupby("b", observed=True).is_play_action.mean()
# what losing a down costs: chance the series succeeds from 2nd & k versus 3rd & k (own 20 to opp 30)
mid = N5[N5.yardline_100.between(30, 80) & N5.series_success.notna()]
COST = pd.DataFrame({k: [mid[(mid.down == 2) & (mid.ydstogo == k)].series_success.mean(),
                         mid[(mid.down == 3) & (mid.ydstogo == k)].series_success.mean()]
                     for k in range(1, 11)}, index=["second", "third"]).T
COST["cost"] = COST.second - COST.third
S["cost1"], S["cost7"] = COST.loc[1, "cost"], COST.loc[[5, 6, 7, 8, 9, 10], "cost"].mean()
S["s2_1"], S["s3_1"] = COST.loc[1, "second"], COST.loc[1, "third"]
S["s2_10"], S["s3_10"] = COST.loc[10, "second"], COST.loc[10, "third"]

# ---- second-and-10 after an incompletion versus after a no-gain run
a10 = N5[(N5.down == 2) & (N5.ydstogo == 10) & (N5.prev_down == 1)]
S["pr_after_inc"] = a10[a10.prev_inc == 1]["pass"].mean()
S["pr_after_run"] = a10[(a10.prev_type == "run")]["pass"].mean()
S["n_after_inc"], S["n_after_run"] = int((a10.prev_inc == 1).sum()), int((a10.prev_type == "run").sum())
a79 = N5[(N5.down == 2) & N5.ydstogo.between(7, 9) & (N5.prev_down == 1)]
S["pr79_run"], S["pr79_pass"] = a79[a79.prev_type == "run"]["pass"].mean(), a79[a79.prev_type == "pass"]["pass"].mean()

# ---- field zones
N10["zone"] = N10.yardline_100.map(zone_of)
fz = N10[(N10.down == 1) & ((N10.ydstogo == 10) | (N10.goal_to_go == 1))]
ZT = fz.groupby("zone").agg(pr=("pass", "mean"), sg=("shotgun", "mean"), epa=("epa", "mean"),
                            sr=("success", "mean"), sack=("sack", "sum"), db=("qb_dropback", "sum"),
                            n=("pass", "size"))
ZT["sack_rate"] = ZT.sack / ZT.db
S["bu_pr"], S["of_pr"] = ZT.loc["backed up", "pr"], ZT.loc["open field", "pr"]
S["bu_sg"], S["of_sg"] = ZT.loc["backed up", "sg"], ZT.loc["open field", "sg"]
S["bu_sack"], S["of_sack"] = ZT.loc["backed up", "sack_rate"], ZT.loc["open field", "sack_rate"]
S["bu_sr"], S["of_sr"] = ZT.loc["backed up", "sr"], ZT.loc["open field", "sr"]
S["co_pr"] = ZT.loc["coming out", "pr"]
# coming out: where the opponent's next drive starts after a punt, by where the punt came from (2021-2025)
PU = reg[(reg.play_type == "punt") & (reg.season >= 2021)][["game_id", "play_id", "posteam", "yardline_100"]]
NX = (snaps[snaps.season >= 2021][["game_id", "play_id", "posteam", "yardline_100"]]
      .rename(columns={"posteam": "next_team", "yardline_100": "next_y100"}))
PU = pd.merge_asof(PU.sort_values("play_id"), NX.sort_values("play_id"), on="play_id", by="game_id",
                   direction="forward", allow_exact_matches=False)
PU = PU[PU.next_team.notna() & (PU.next_team != PU.posteam)]
# the opponent's starting yard line, in its own yards (100 - its yards to go)
S["punt_from_10_15"] = 100 - PU[PU.yardline_100.between(85, 90)].next_y100.mean()
S["punt_from_25_30"] = 100 - PU[PU.yardline_100.between(70, 75)].next_y100.mean()
# field-goal range is moving out: tries of 50+ yards, 2016 versus 2025
fg = reg[(reg.play_type == "field_goal") & reg.kick_distance.notna()].copy()
fg["made"] = fg.field_goal_result == "made"
FG50 = fg[fg.kick_distance >= 50].groupby("season").made.agg(["size", "mean"])
S["fg50_n16"], S["fg50_n25"] = int(FG50.loc[2016, "size"]), int(FG50.loc[2025, "size"])
S["fg50_p16"], S["fg50_p25"] = FG50.loc[2016, "mean"], FG50.loc[2025, "mean"]
# third-and-1 is a running down everywhere; the yard line's effect shows on third-and-2-to-4
t31 = N10[(N10.down == 3) & (N10.ydstogo == 1)]
S["t31_pr"] = t31["pass"].mean()
# third-and-2-to-4: own half versus opponent's half outside the red zone
t3 = N10[(N10.down == 3) & N10.ydstogo.between(2, 4)]
S["t3_own"] = t3[t3.yardline_100.between(51, 80)]["pass"].mean()
S["t3_plus"] = t3[t3.yardline_100.between(21, 49)]["pass"].mean()
S["t3_own_fd"] = t3[t3.yardline_100.between(51, 80)].first_down.mean()
S["t3_plus_fd"] = t3[t3.yardline_100.between(21, 49)].first_down.mean()
# fourth-and-1-to-3, 2025: go-for-it rate by half of the field (outside the last two minutes)
f4 = reg[(reg.season == 2025) & (reg.down == 4) & (reg.ydstogo <= 3) & (reg.half_seconds_remaining > 120)
         & reg.play_type.isin(["pass", "run", "punt", "field_goal"])].copy()
f4["go"] = f4.play_type.isin(["pass", "run"])
S["go_plus"] = f4[f4.yardline_100.between(21, 49)].go.mean()
S["go_own"] = f4[f4.yardline_100.between(51, 79)].go.mean()

# ---- case-study numbers
f4all = reg[(reg.down == 4) & reg.play_type.isin(["pass", "run"])]
GO = f4all.groupby(["season", "posteam"]).agg(att=("first_down", "size"), conv=("first_down", "sum"))
GO["rk"] = GO.groupby(level=0).att.rank(ascending=False, method="min").astype(int)
# the 2018 Rams' personnel: share of their runs and passes in 11 personnel (NGS participation, 2018)
part = nfl().load_participation([2018]).to_pandas()[["nflverse_game_id", "play_id", "offense_personnel"]]
p18 = reg[(reg.season == 2018) & reg.play_type.isin(["pass", "run"])].merge(
    part, left_on=["game_id", "play_id"], right_on=["nflverse_game_id", "play_id"])


def rb_te(s):
    """'1 RB, 1 TE, 3 WR' -> '11'."""
    if not isinstance(s, str):
        return None
    d = {pos.strip(): int(n) for n, pos in (x.strip().split(" ", 1) for x in s.split(","))}
    return f"{d.get('RB', 0)}{d.get('TE', 0)}"


p18["pers"] = p18.offense_personnel.map(rb_te)
P11 = p18.groupby("posteam").pers.apply(lambda x: (x == "11").mean())
S["la18_11"], S["lg18_11"] = P11.loc["LA"], (p18.pers == "11").mean()
S["la18_11_top"] = P11.idxmax() == "LA"


# ---- the watch-for-it tag table, 2021-2025: down-and-distance bucket plus field zone
def tag(r):
    if r.down == 1:
        return "1st & 10, " + zone_of(r.yardline_100) if r.yardline_100 > 20 else "1st & 10 (or goal), red zone"
    if r.down == 2:
        return {SB[0]: "2nd & short (1–3)", SB[1]: "2nd & medium (4–6)", SB[2]: "2nd & long (7–10)",
                SB[3]: "2nd & very long (11+)"}[pd.cut([r.ydstogo], [0, 3, 6, 10, 99], labels=SB)[0]]
    if r.down == 3:
        if r.ydstogo == 1:
            return "3rd & 1, anywhere"
        if r.ydstogo <= 4:
            return "3rd & 2–4, own half" if r.yardline_100 >= 50 else "3rd & 2–4, their half"
        return "3rd & 5 or more"
    return None


TAGS = N5[(N5.down <= 3) & ((N5.down > 1) | (N5.ydstogo == 10) | (N5.goal_to_go == 1))].copy()
TAGS["tag"] = TAGS.apply(tag, axis=1)
TAG_T = TAGS.groupby("tag").agg(pr=("pass", "mean"), n=("pass", "size"))
TAG_T["guess"] = np.where(TAG_T.pr >= 0.5, "pass", "run")
TAG_T["acc"] = np.maximum(TAG_T.pr, 1 - TAG_T.pr)
TAG_ORDER = ["1st & 10, backed up", "1st & 10, coming out", "1st & 10, open field",
             "1st & 10, four-down territory", "1st & 10 (or goal), red zone",
             "2nd & short (1–3)", "2nd & medium (4–6)", "2nd & long (7–10)", "2nd & very long (11+)",
             "3rd & 1, anywhere", "3rd & 2–4, own half", "3rd & 2–4, their half", "3rd & 5 or more"]
S["tag_acc"] = (TAGS.tag.map(TAG_T.guess) == np.where(TAGS["pass"] == 1, "pass", "run")).mean()

First quarter, no score, first-and-10 at the offense’s own 25. The back runs for two yards, and the analyst approves: they’re “establishing the run.” Next series, first-and-10 again, a quick throw gains nine, and now the analyst perks up: second-and-1 is “a free play,” the perfect time for a shot down the field. (That’s booth slang. On the field a free play is stricter: a snap on which the defense has jumped offside, so the offense can’t lose.) The offense hands the ball off again. A few series later the same offense faces third-and-3 at the other team’s 38, on a down where offenses threw 86% of the time when the ball sat in their own half, and this time it runs. Nothing about the players has changed. The situation has: which down it is, how far there is to go, and where the ball sits on a field that coaches carve into zones with names. This chapter teaches you to read those three things the way a play-caller does, and to check what the broadcast booth tells you against what teams actually do.

You’ll be able to…

NoteYou’ll need

How to read the diagrams. Offense is blue circles, defense orange squares, and left and right are always the offense’s. Q is the quarterback, R the running back, Y and U the tight ends, and X, Z and H the wide receivers; C is the center. On defense, E and T are the ends and tackles, S, M and W the Sam, Mike and Will linebackers, $ the nickel back, CB the cornerbacks and FS and SS the safeties. Lines ending in a bar are blocks, arrows are paths, and a dashed brown arrow is the throw. The yellow line is the line to gain. In the charts, “neutral situations” means what it meant in 01-02: outside the last two minutes of each half, with each team’s win probability between 20% and 80%, so that the score and the clock aren’t making the call.

The situation comes before the play

A play-caller does not walk into a game with a list of “good plays” and pick his favorite. He walks in with a call sheet, the laminated card you see covering his mouth on the sideline, and that card is organized by situation. One box for first-and-10, one for second-and-long, one for second-and-short, a few for third down cut by distance, then boxes for the places on the field where the rules of the game change the math: backed up against your own goal line, coming out, the red zone, the goal line. A separate panel handles the clock: the two-minute drill and the four-minute offense, where the score and the time left are the situation.

One thing sits on top of the boxes: the opening script, a list of about 15 plays the play-caller picks before the game and calls in order on ordinary first and second downs. Bill Walsh’s 49ers made it famous, and The Game Plan shows how one is built. So many of a team’s first-quarter early downs come off a list written before the game, not off the situation boxes. Keep that in mind when this chapter measures what teams did early in games: some of it was planned, not reactive.

Strip away the score and the clock and three numbers define a situation: the down, the distance to the line to gain, and the yard line. This chapter is about all three on the first two downs of a series, and about the yard line everywhere.

Start with the downs. First and second down are the early downs: the snaps where the offense still has at least one more try in hand before the down that decides whether it punts. That one extra try is what makes them different. On third down the offense must gain the yards, and the defense knows it, so third down gets its own chapter (Third Down: The Money Down). On an early down nothing is forced. A play-caller can run, throw short, throw deep, fake one and do the other, and the defense has to be ready for all of it. Early downs are also most of the game: about three snaps in four are first or second downs.

NoteMadden vs. real life

In a video game you see the same playbook menu on every snap, and the “situation” is something you notice if you feel like it. A real play-caller’s options are pre-filtered by situation before the game starts. On his own 2-yard line, half of his passing game is crossed off the sheet; on second-and-1 a box of deep shots appears that he would never call on second-and-11. When you hear a coordinator say “we were in a good situation for that call,” he means the call was on the right part of the sheet.

First down: the freest snap in football

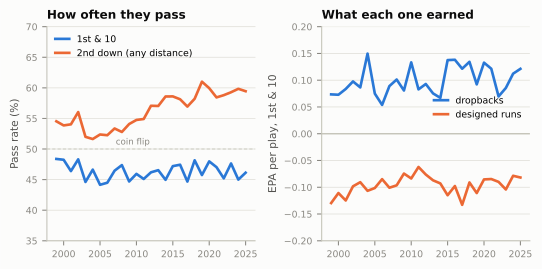
If any snap is a true guess for the defense, it’s first-and-10. Here is how often offenses have thrown on it, in neutral situations, for every season the play-by-play covers. (Throughout this chapter a “pass” is a called pass, or dropback: the quarterback sets up to throw, so sacks and scrambles count as passes. A “run” is a designed run.)

Show the Python
fig, (a1, a2) = plt.subplots(1, 2, figsize=(6.5, 2.9), gridspec_kw=dict(wspace=0.32))
yrs = TREND.index.values
a1.plot(yrs, TREND.values * 100, color=style.SERIES[0], lw=2, label="1st & 10")
a1.plot(yrs, TREND2.values * 100, color=style.SERIES[1], lw=2, label="2nd down (any distance)")
a1.set_ylim(35, 70)
a1.set_ylabel("Pass rate (%)", fontsize=8)
a1.axhline(50, color=style.BASELINE, lw=0.8, ls=(0, (3, 2)), zorder=1)
a1.text(2009.5, 50.4, "coin flip", fontsize=6.5, color=style.MUTED, va="bottom", ha="center")
a1.legend(loc="upper left", fontsize=7, handlelength=1.5)
a1.set_title("How often they pass", fontsize=9)
a2.plot(yrs, GAP[1].values, color=style.SERIES[0], lw=2, label="dropbacks")
a2.plot(yrs, GAP[0].values, color=style.SERIES[1], lw=2, label="designed runs")
a2.axhline(0, color=style.BASELINE, lw=1)
a2.set_ylabel("EPA per play, 1st & 10", fontsize=8)
a2.set_ylim(-0.2, 0.2)
a2.legend(loc="center right", fontsize=7, handlelength=1.5, bbox_to_anchor=(1.0, 0.62))
a2.set_title("What each one earned", fontsize=9)
for a in (a1, a2):
    a.set_xticks([2000, 2005, 2010, 2015, 2020, 2025])
    a.tick_params(labelsize=7)
    a.grid(axis="x", visible=False)
plt.show()
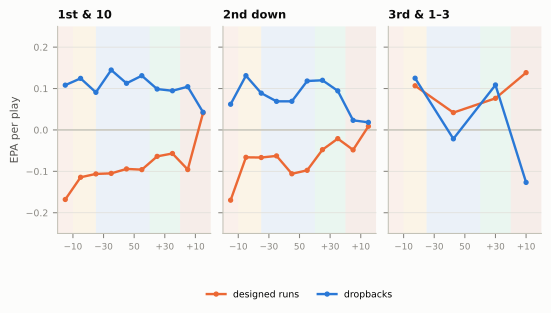
Figure 50.1: Left: how often offenses passed on first-and-10 (blue) and on second down (orange), neutral situations, every regular season from 1999 to 2025. A pass is a called pass, so sacks and scrambles count. First-and-10 has barely moved in 27 years; second down has drifted toward the pass. Right: what each choice earned on first-and-10, in EPA per play. A dropback beat a run in every one of the 27 seasons, by roughly 0.15 to 0.25 points a play. Source: nflverse play-by-play.

Two facts sit side by side in that chart, and the tension between them is the whole early-down debate.

The first fact: first-and-10 is a coin flip, and it always has been. In every season since 1999, offenses in neutral situations have thrown on between 44% and 48% of their first-and-10 snaps (46% in 2025). Over the same years the league remade itself: the shotgun went from a passing-down formation to the default, the spread arrived from college, the rules protected quarterbacks and receivers more every few years. Second down moved with it, from about 54% passes in the first five seasons of the data to about 59% in the last five. First down didn’t.1

The second fact: the pass has been the better bet on first-and-10 every single year. A dropback out-earned a designed run by between 0.14 and 0.26 points of EPA per play, and the run has averaged a loss of expected points in all 27 seasons. A tenth of a point per play, you’ll remember from 01-02, is roughly the gap between a good offense and an average one. So the obvious question: if passing on first down is that much better, why hasn’t anyone’s first-down pass rate moved?

There are four honest answers, and none of them is “coaches are fools.”

  1. The averages aren’t a fair fight. First-down runs and passes are not run against the same defenses. Offenses call passes when the defense looks ready for the run, and many first-down passes are play-action, which borrows its value from the run’s existence. Take the run away and the pass faces a defense that knows it’s coming. This is the selection effect you met with box counts in A First Look at Defense, and Expected Points, EPA, and Success Rate will deal with it head on.
  2. Balance is the point of first down. First-and-10 is the one snap where the defense can’t lean. A team that throws 80% of the time on first down has handed the defense a tendency, and the defense will play pass on first down until the edge is gone. In the language of 08-02, the run is what keeps the pass from being a guess the defense wins.
  3. Coaches price risk, not just averages. A run almost never loses ten yards or the ball; a pass sometimes does both. EPA counts sacks and interceptions in its average, but a head coach who answers for every turnover on Monday weighs a disaster more heavily than a bonus. The economist David Romer found the same lean in NFL fourth-down decisions twenty years ago.2
  4. Runs buy things EPA doesn’t price. A run keeps the clock moving when you’re ahead, keeps a pass rush from teeing off on every snap, and spares your quarterback a hit.

Weigh those and you get the position most analysts actually hold. It isn’t “never run.” It’s that the average first-down run has been a worse bet than the average first-down pass for a generation, that most teams could throw a little more on early downs before the pass’s edge wore off, and that the teams who do it well tend to have the better offenses. That “how much more than expected” idea has a name, pass rate over expected (PROE), and a chapter of its own (Tendencies: PROE, Personnel, Motion, and Coverage).

ImportantWhy it exists: balance on first down

First-and-10 is balanced because balance is what first down is for. It is the one snap where a defense has nothing to go on but the formation and the film, so a play-caller who keeps it near a coin flip forces the defense to defend everything, and makes every later down easier to call. The price is the gap in the chart: each first-down run called “to stay balanced” gives up, on average, a slice of expected points. The good offenses keep the balance and shrink the price, with runs that look exactly like their passes and passes that look exactly like their runs.

On schedule and behind schedule

Coaches don’t talk about first down in EPA. They talk about the schedule. An offense is on schedule when its early downs leave it a manageable next down: about 4 yards or more on first-and-10, then a little more than half of what’s left on second down, so that third down is short or never comes. It’s behind schedule when a short gain, a loss, a sack, an incompletion or a penalty leaves second-and-long or third-and-long. The yardage version of success rate from 01-02, 40% of the needed yards on first down and 60% on second, is the schedule turned into a number: 4 of the 10 on first down, then 60% of whatever is left (4 of the 6 after a 4-yard gain), which leaves a third-and-2.

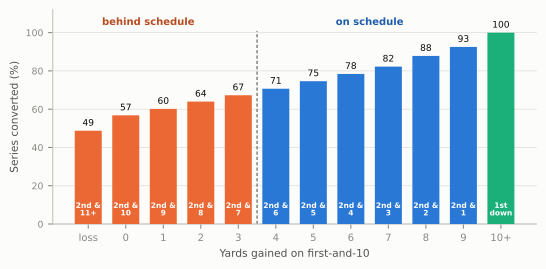
Why 4 yards? Because of what each first-down result does to the rest of the series:

Show the Python
fig, ax = plt.subplots(figsize=(6.5, 2.9))
xs = list(SCHED.index)
labs = ["loss"] + [str(g) for g in range(0, 10)] + ["10+"]
cols = [style.DEFENSE if g < 4 else style.OFFENSE for g in xs]
cols[-1] = style.THIRD
ax.bar(range(len(xs)), SCHED.succ.values * 100, color=cols, width=0.72, zorder=3)
for i, (g, v) in enumerate(zip(xs, SCHED.succ.values)):
    ax.text(i, v * 100 + 1.5, f"{v * 100:.0f}", ha="center", va="bottom", fontsize=6.8, color=style.INK)
    nxt = "2nd &\n11+" if g < 0 else ("1st\ndown" if g >= 10 else f"2nd &\n{10 - g}")
    ax.text(i, 4, nxt, ha="center", va="bottom", fontsize=5.6, color="white", linespacing=1.0, zorder=4,
            fontweight="bold")
ax.set_xticks(range(len(xs)), labs, fontsize=7.5)
ax.set_xlabel("Yards gained on first-and-10", fontsize=8)
ax.set_ylabel("Series converted (%)", fontsize=8)
ax.set_ylim(0, 112)
ax.tick_params(axis="y", labelsize=7)
ax.grid(axis="x", visible=False)
ax.text(1.6, 104, "behind schedule", ha="center", fontsize=7.5, color=style.DEFENSE_DARK, fontweight="bold")
ax.text(7.5, 104, "on schedule", ha="center", fontsize=7.5, color=style.OFFENSE_DARK, fontweight="bold")
ax.axvline(4.5, color=style.INK_2, lw=0.8, ls=(0, (3, 2)), ymax=0.9)
plt.show()
Figure 50.2: What a first-and-10 play sets up: the chance the series ends in a first down or a touchdown, by the yards the first-down play gained (neutral situations between the offense’s own 20 and the opponent’s 30, 2016-2025 regular seasons; plays that ended in a turnover are left out). A 0 includes incompletions; ‘loss’ includes sacks. Each bar is labelled with the second down it leaves. Every yard helps, by three or four percentage points of conversion; the costliest result is a loss. Coaches draw the ‘on schedule’ line at about 4 yards, where second down is 6 or shorter. Source: nflverse play-by-play.

Read the bars as the price of first down. A first-down play that loses yards (a sack, a run stuffed in the backfield) leaves a series that converts only 49% of the time; an incompletion or a no-gain run, 57%. After that there’s no cliff: every yard is worth three or four percentage points of conversion, and 4 yards gets the series to 71%. Coaches draw the line at about 4 because second-and-6 or shorter still leaves room for a run and a pass, and puts a third-and-short within one ordinary play. The EPA bookkeeping from 01-02 lands in nearly the same place: the smallest first-and-10 gain whose average EPA is positive is 5 yards. The coaches’ rule of thumb and the analysts’ model describe the same slope and draw the line within a yard of each other.

The bars also show what coaches fear most on first down, and it isn’t the incompletion. It’s the negative play. A sack or a tackle for loss (8% of these first downs) does more damage than an incompletion, because it spends the down and lengthens the distance. A holding penalty is worse still: first-and-20. That is why so much of the modern early-down passing game is built to be safe as well as productive (the quick game, screens, play-action with the quarterback rolling away from pressure) and why a quarterback who takes a sack on first down hears about it in the film room.

CautionCommon misconception

“Second-and-long is no big deal: you still have two downs.” Look at the bars again. A first-down play that gains nothing leaves a series that converts 57% of the time; a 4-yard gain leaves one that converts 71%. Either way the offense has two downs left, but two downs to gain ten yards is a much harder problem than two downs to gain six, and the defense knows it: on second-and-long it can start playing the pass.

“Establish the run”: what the claim says, and what survives

Every broadcast has an announcer who says a team needs to “establish the run”: run the ball early and often, and good things will follow. It is one of the oldest pieces of football wisdom, and it is really four different claims bundled together. The data treats them very differently.

Claim 1: running wears the defense down, so the runs get better as the game goes on. If that were true, early-down runs in close games should gain more in the fourth quarter than in the first. They barely do. From 2016 to 2025 they averaged −0.09 EPA in the first quarter and −0.07 in the fourth, a hair better and nowhere near closing the gap to passes, which averaged +0.10 and +0.09.3 Big, physical offenses do tire defenses on some days, and you’ll see it on individual drives. It just doesn’t show up as a rule.

Claim 2: you have to run to make play-action work. This one has been tested hardest, and it fails. Play-Action, Bootlegs, and Screens walks through the evidence: play-action passes beat ordinary dropbacks by about the same margin whether a team’s run game is good, bad or barely used. Linebackers react to the look of the run (the line’s first step, the back’s path) because reacting is their job, not because a running back has been gaining yards. What survives is the weaker point: the fake has to look exactly like your real run, so you need a real run to copy.

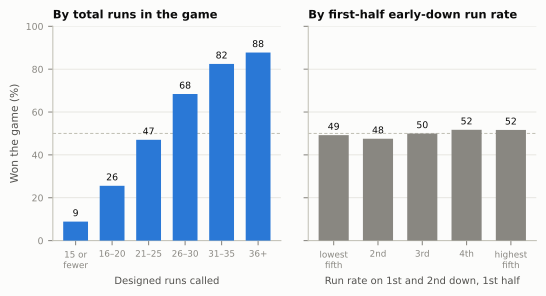
Claim 3: teams that run the ball win. This is the claim that keeps the phrase alive, because the correlation is real and enormous. Here it is, beside the version of it that matters:

Show the Python
fig, (a1, a2) = plt.subplots(1, 2, figsize=(6.5, 2.9), sharey=True, gridspec_kw=dict(wspace=0.12))
for a, tab, title, xl in [(a1, WIN_RUNS, "By total runs in the game", "Designed runs called"),
                          (a2, WIN_H1, "By first-half early-down run rate", "Run rate on 1st and 2nd down, 1st half")]:
    xs_ = range(len(tab))
    a.bar(xs_, tab["mean"] * 100, color=style.SERIES[0] if a is a1 else style.MUTED, width=0.68, zorder=3)
    for i, v in zip(xs_, tab["mean"]):
        a.text(i, v * 100 + 1.5, f"{v * 100:.0f}", ha="center", va="bottom", fontsize=7, color=style.INK)
    a.set_xticks(list(xs_), [str(i) for i in tab.index], fontsize=6.6)
    a.set_xlabel(xl, fontsize=7.5)
    a.set_title(title, fontsize=8.6)
    a.axhline(50, color=style.BASELINE, lw=0.8, ls=(0, (3, 2)), zorder=1)
    a.grid(axis="x", visible=False)
    a.tick_params(axis="y", labelsize=7)
a1.set_ylabel("Won the game (%)", fontsize=8)
a1.set_ylim(0, 100)
plt.show()
Figure 50.3: Two ways to connect running and winning, every regular-season team-game from 2016 to 2025 (ties left out). Left: win rate by how many designed runs a team called in the game. Teams with 31 or more runs won more than four times in five. Right: win rate by how often the team ran on first and second down in the first half, split into five equal-sized groups. The line is flat: running a lot early told you nothing about who would win. The difference is direction. Teams run a lot because they are ahead (protecting a lead, running out the clock), not ahead because they ran. Source: nflverse play-by-play.

On the left, the famous version: teams that ran more than 30 times won 84% of their games; teams that ran 20 times or fewer won 20%. On the right, the version a play-caller can actually choose: how much a team leaned on the run on early downs in the first half, before the score had a say. Every fifth of that scale won about half its games.4

The left panel runs backward. A team that leads in the fourth quarter runs to drain the clock (the four-minute offense), and a team that trails throws to catch up. Across these games, a team’s fourth-quarter run rate correlated with winning at 0.67; its first-half early-down run rate, at 0.03 (a correlation runs from 0, no connection at all, to 1, a perfect one). Winning causes running. Running, by itself, doesn’t cause winning.

Claim 4: the run keeps the defense honest. This one survives, and it’s the reason the debate never ends. A defense that doesn’t have to respect the run can drop seven or eight players into coverage on every early down, rush four, and make the pass much harder. The run’s value isn’t only its own EPA; part of it shows up in the pass’s EPA. That is constraint theory again, and it explains why the best offenses of the analytics era did not simply stop running. It also explains what does make a run game worth leaning on: being efficient, not being frequent. A run that gains as much as a pass (because the defense is outnumbered, or because the quarterback is a running threat) is worth calling often. A run that’s merely “establishing” something is the price you pay for balance.

Show the Python
fig, ax = plt.subplots(figsize=(6.5, 3.9))
ax.scatter(TEAM.pr * 100, TEAM.epa, s=14, color=style.MUTED, alpha=0.45, edgecolor="none", zorder=2)
ax.axvline(TEAM.pr.mean() * 100, color=style.BASELINE, lw=0.9, ls=(0, (3, 2)), zorder=1)
ax.axhline(TEAM.epa.mean(), color=style.BASELINE, lw=0.9, ls=(0, (3, 2)), zorder=1)
OFFS = {(2018, "KC"): (8, 6, "left"), (2018, "LA"): (8, 10, "left"), (2019, "BAL"): (0, 14, "center"),
        (2023, "DET"): (-8, -14, "right"), (2024, "DET"): (10, 12, "left")}
for k, name in CASES.items():
    t = TEAM.loc[k]
    col = style.SERIES[1] if k[1] == "BAL" else (style.SERIES[2] if k[1] == "DET" else style.SERIES[0])
    ax.scatter([t.pr * 100], [t.epa], s=46, color=col, edgecolor="white", lw=0.8, zorder=4)
    dx, dy, ha = OFFS[k]
    ax.annotate(name, (t.pr * 100, t.epa), xytext=(dx, dy), textcoords="offset points", fontsize=7.5,
                color=style.INK, ha=ha, va="center", zorder=5,
                arrowprops=dict(arrowstyle="-", color=style.INK_2, lw=0.6, shrinkA=0, shrinkB=4))
ax.set_xlabel("Pass rate on first and second down (%)", fontsize=8)
ax.set_ylabel("EPA per play, first and second down", fontsize=8)
ax.tick_params(labelsize=7.5)
ax.text(TEAM.pr.mean() * 100 + 0.3, ax.get_ylim()[0] + 0.01, "league-average pass rate", fontsize=6.5,
        color=style.MUTED, va="bottom")
ax.text(ax.get_xlim()[1] - 0.3, TEAM.epa.mean() + 0.006, "league-average EPA", fontsize=6.5, color=style.MUTED,
        va="bottom", ha="right")
plt.show()
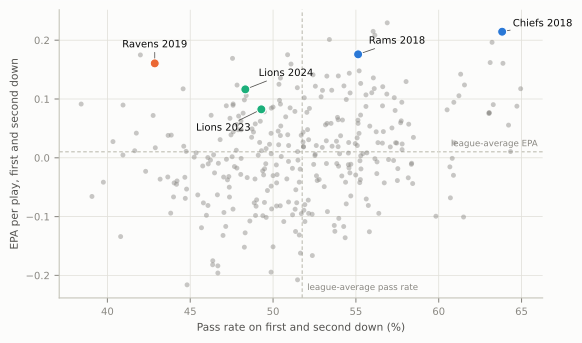
Figure 50.4: Every offense from 2016 to 2025 (320 team-seasons) on first and second down in neutral situations: how often it passed (across) and what it earned per play (up). The dashed lines are the averages. The cloud tilts up a little, since passing more goes with scoring more, but loosely: the best offenses of the decade sit on both sides of the average pass rate. The five labelled seasons are this chapter’s case studies. Source: nflverse play-by-play.

The chart is the debate in one picture. Passing more goes with better offense, but loosely (a correlation of 0.26 across these team-seasons, on that 0-to-1 scale): plenty of pass-happy teams were bad, and some of the best offenses of the decade ran more than average. What the offenses near the top of the chart share, whichever side of the average pass rate they sit on, is efficiency on both kinds of play, or a run game good enough that the usual price of running wasn’t there. The three film-room boxes take the labelled seasons one at a time.

NoteFilm room: Kansas City Chiefs and Los Angeles Rams, 2018

The season: a year the analytics argument still points to, because the two best offenses in football leaned on early-down passing. Kansas City (12–4) led the NFL with 565 points in Patrick Mahomes’s first season as a starter; the Rams (13–3), in Sean McVay’s second season, were second with 527.5 In neutral situations on first and second down, the Chiefs ranked 2nd in how often they passed and first in EPA per play; the Rams ranked only 11th in how often they passed but 3rd in what they earned, with a play-action game built to look exactly like their outside-zone runs (the Rams film room in 04-05 has the details). Part of how McVay made runs and passes look alike was sameness of personnel: the Rams lined up in 11 personnel (one back, one tight end, three receivers) on 93% of their runs and passes, the most in the league (the league average was 65%), so the defense never got a personnel clue about which was coming.6

The game: Monday night, November 19, 2018, moved from Mexico City to the Los Angeles Memorial Coliseum six days before kickoff because of the condition of the field in Mexico. The Rams won 54–51. Mahomes threw for 478 yards and six touchdowns, with three interceptions; Jared Goff threw for 413 and four touchdowns, and the two defenses scored three touchdowns between them on turnovers.7 Both offenses threw on about seven of every ten first downs that night.

What to notice: the Rams’ passing rate is the lesson. “Pass more on early downs” was never the whole recipe. The Rams were only a little above average in how often they threw; what set them apart was how much each early-down pass earned, and that their runs (2nd in early-down run EPA) were good enough that the defense had to honor them on every snap. Kansas City’s runs ranked 3rd. The best early-down offenses of 2018 were efficient at both, and leaned toward the pass.

And notice what didn’t spread. The league’s neutral first-and-10 pass rate in 2018 was 48%, the highest of the decade, and no season since has matched it (the flat blue line in the first chart). What the rest of the league copied from these two offenses was how they threw (play-action, motion, runs and passes from the same look), not how often.

NoteFilm room: Baltimore Ravens, 2019

The season: the counter-example every “pass more” chart has to answer. The 2019 Ravens went 14–2, led the NFL with 531 points and ran for 3,296 yards, the most by any team in NFL history, with Lamar Jackson setting the quarterback record of 1,206 rushing yards on his way to a unanimous MVP award.8 On first and second down in neutral situations they passed less often than any other team (32nd of 32), and they were first in EPA per play.

What to notice: their runs were first in the league in early-down EPA too (+0.09 per run, against a league average close to −0.08). A quarterback who is a real running threat changes the arithmetic of the run game: on option and quarterback-run plays the defense has to account for one more ball carrier, so the offense effectively gains a blocker (Option Football shows how). When a run is as good as a pass, “establishing” it costs nothing, and calling it often is simply good football. The Ravens weren’t proof that running wins; they were proof that efficient running wins.

The coda: in the divisional round, the Titans jumped ahead and beat them 28–12. Behind on the scoreboard, the Ravens threw on about three of every four early downs that night, and the offense built on the run’s threat looked ordinary. Situation decides even for the best run game in history. (The whole Baltimore era is a case study of its own.)

Second down: four buckets

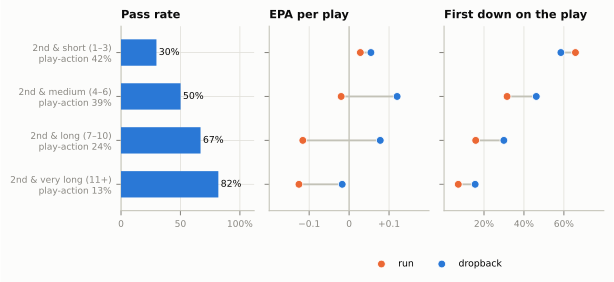
Second down is where the schedule shows up. Whatever happened on first down sets the distance, and the distance sorts second downs into four buckets that call for different football:

Show the Python
fig, axes = plt.subplots(1, 3, figsize=(6.5, 2.5), sharey=True, gridspec_kw=dict(width_ratios=[1.0, 1.2, 1.2],
                                                                                  wspace=0.10))
ys = np.arange(len(SB))[::-1]
a0, a1, a2 = axes
a0.barh(ys, SEC.pr.values * 100, color=style.SERIES[0], height=0.6, zorder=3)
for y_, v in zip(ys, SEC.pr.values):
    a0.text(v * 100 + 2, y_, f"{v * 100:.0f}%", va="center", fontsize=7, color=style.INK)
a0.set_xlim(0, 112); a0.set_xticks([0, 50, 100], ["0", "50", "100%"], fontsize=6.8)
a0.set_title("Pass rate", fontsize=8.5)
a0.set_yticks(ys, [f"2nd & {b}\nplay-action {PA2.loc[b]:.0%}" for b in SB], fontsize=6.8)
for a, tab, title, fmt, lim in [(a1, SEC_EPA, "EPA per play", lambda v: signed(v), (-0.2, 0.2)),
                                (a2, SEC_FD, "First down on the play", lambda v: f"{v:.0%}", (0, 0.8))]:
    for k, (col, lab) in enumerate([(style.SERIES[1], "run"), (style.SERIES[0], "dropback")]):
        vals = tab[k].values
        a.scatter(vals, ys, s=34, color=col, zorder=3, label=lab, edgecolor="white", lw=0.6)
    for y_, r0, r1 in zip(ys, tab[0].values, tab[1].values):
        a.plot([r0, r1], [y_, y_], color=style.BASELINE, lw=1.4, zorder=2)
    a.set_xlim(*lim)
    a.set_title(title, fontsize=8.5)
    a.tick_params(axis="x", labelsize=6.8)
    a.grid(axis="y", visible=False)
a1.axvline(0, color=style.BASELINE, lw=0.9)
a1.set_xticks([-0.1, 0, 0.1], [MINUS + "0.1", "0", "+0.1"])
a2.set_xticks([0.2, 0.4, 0.6], ["20%", "40%", "60%"])
a1.legend(loc="lower center", bbox_to_anchor=(1.05, -0.36), ncol=2, fontsize=7)
for a in axes:
    a.set_ylim(-0.6, len(SB) - 0.4)
plt.show()
Figure 50.5: Second down by bucket, neutral situations, 2021-2025 regular seasons. Left: how often offenses passed. Middle: EPA per play for designed runs (orange) and dropbacks (blue). Right: how often each one gained a first down on the spot. The pass earns more in every bucket, by the least on second-and-short, where runs convert two times in three. The play-action share is the percentage of each bucket’s passes that faked a handoff (FTN charting, 2022-2025). Source: nflverse play-by-play and FTN charting.
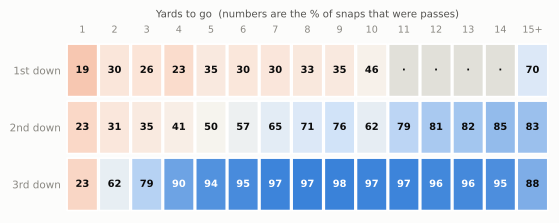
  • Second-and-short (1 to 3) is a running down in practice: offenses ran on 70% of these snaps (and on 77% of second-and-1s). It is also, in theory, the best passing down in football. The next two sections take both halves of that contradiction: why it’s a shot down, and why most teams run anyway.
  • Second-and-medium (4 to 6) is the true toss-up: offenses split almost exactly half and half, even though the pass has out-earned the run by a wide margin here too. An offense here is on schedule, and every call on the sheet is live.
  • Second-and-long (7 to 10) is the most common second down, the usual result of an incompletion or a short run. The offense is behind schedule, and its job is to get half of it back: a 5-yard gain turns third-and-long into third-and-short. Offenses throw about two times in three, and the pass is clearly the better bet.
  • Second-and-very-long (11 or more) follows a sack, a penalty or a loss. Offenses throw more than four times in five, and defenses play deep, conceding the short throw (the second drill in 01-02 shows that picture). The goal is a makeable third down, not the whole distance, which is where the draw and the screen earn their place.

Why second-and-short is a shot down

Every coach knows the logic, and you heard it from the analyst in the opening paragraph. On second-and-1 the offense has two downs to gain one yard. It can afford to spend one of them on a shot play, a pass aimed deep down the field, because if the shot falls incomplete it’s third-and-1, the easiest third down there is. Three things make the shot unusually good here, and the first one can be measured.

1. Failure is cheap. Losing a down costs less on second-and-short than anywhere else. From second-and-1, a series converted 94% of the time; from third-and-1, 81%. A wasted second down cost 13 percentage points of conversion. From second-and-5 or longer, a wasted down cost about 24 percentage points on average: from second-and-10 to third-and-10 is 57% to 33%. The same incompletion is about half as expensive on second-and-1.9

2. The offense’s own look pulls the defense into run mode. In the NFL a defense’s personnel follows the offense’s personnel, not the down. Teams often answer second-and-short with heavy personnel (two tight ends, or a fullback) and the quarterback under center, the same look they run from. Heavy personnel draws the defense’s base personnel; base personnel on a run-heavy down puts an eighth defender in the box, usually a safety walked down; and eight in the box leaves one deep safety to cover the whole middle of the field. Linebackers on short yardage are coached to attack the line the moment they see a run action, because a yard is all the offense needs. (Against three receivers, most defenses stay in nickel and walk a safety down instead. That one-high look invites the same shot.)

3. The fake is believable. Because the look is the run look, a run fake sells. On second-and-short, 42% of passes were play-action, against 24% on second-and-long and 13% on second-and-very-long.

Put those together and this is what the shot looks like:

Show the Python
LOS_SHOT = 55.0
def shot_play():
    off = line() + [O("QB", "QB", -1.9, 0.0, "Q"), O("RB", "RB", -7.0, 0.0, "R"),
                    O("Y", "TE", -0.7, 4.8, "Y"), O("U", "TE", -0.7, -4.8, "U"),
                    O("X", "WR", -1.5, -15.0, "X"), O("Z", "WR", -1.5, 14.0, "Z")]
    dfn = [D("WDE", "DE", 1.0, -6.4, "E"), D("WDT", "DT", 1.0, technique("1", -1), "T"),
           D("SDT", "DT", 1.0, technique("3", 1), "T"), D("SDE", "DE", 1.0, 6.4, "E"),
           D("SAM", "SAM", 4.0, 6.0, "S"), D("MIKE", "MIKE", 4.6, 0.8, "M"), D("WILL", "WILL", 4.6, -3.2, "W"),
           D("SS", "SS", 5.5, -7.2, "SS"), D("LCB", "CB", 6.5, -15.5, "CB"), D("RCB", "CB", 6.5, 14.5, "CB"),
           D("FS", "FS", 13.0, 0.5, "FS")]
    p = Play(off, dfn, los=LOS_SHOT, to_go=1)
    # the line fires out as if it were a run, then holds its ground: eight men protect
    for k in ("LT", "LG", "C", "RG", "RT", "Y", "U"):
        p.block(k, pts=[(0.35, 0.0)], speed=1.2)
    for k, dw in (("WDE", (-0.6, 0.6)), ("WDT", (-0.6, 0.0)), ("SDT", (-0.6, 0.0)), ("SDE", (-0.6, -0.6))):
        p.rush(k, pts=[dw], speed=0.8)                           # the rushers are engaged at the line
    p.path("QB", [(-1.4, 1.0)], speed=4.0)                       # open to the back for the fake
    p.path("QB", [(-4.6, -0.8)], speed=4.2)                      # then set up deep
    p.path("RB", [(3.6, 1.4)], speed=5.5)                        # the fake: the same track as the run
    p.block("RB", pts=[(0.9, 0.5)], speed=2.0)                   # then he stays in to block
    p.route("X", [(11.0, 0.0), (28.0, 11.0)], frame="field")     # post from the left, breaking inside
    p.route("Z", [(7.0, -1.0), (17.0, -9.0), (20.0, -24.0)], frame="field")   # deep over (18-22 yards), from the right
    for k, to in (("SAM", (2.7, 5.0)), ("MIKE", (2.8, 1.4)), ("WILL", (2.8, -2.0)), ("SS", (3.0, -5.4))):
        st = p.players[k]
        p.path(k, [(to[0] - st.d, to[1] - st.w)], speed=2.4)      # the run fake pulls them up, hard
    for k, to in (("SAM", (7.5, 3.5)), ("MIKE", (8.0, -0.5)), ("WILL", (7.5, -5.0)), ("SS", (7.5, -10.0))):
        st = p._cur(k)
        p.path(k, [(to[0] - st[0], to[1] - st[1])], speed=4.0)    # ...then turn to chase, too late
    p.drop("FS", (16.0, -1.0), speed=3.0)
    p.drop("FS", (21.5, -3.5), speed=4.2)                         # he carries the post
    p.drop("LCB", (21.0, -18.0), speed=4.5)                       # deep third, outside and over the over
    p.drop("RCB", (17.5, 15.5), speed=4.5)
    p.pass_to("Z", t=3.1)
    return p


SHOT = shot_play()
animation_or_strip(
    SHOT, times=[0.0, 0.9, 3.1, 4.8],
    notes=["2nd & 1: run look, 8 in the box,\none deep safety (purple): Cover 3",
           "the fake: linebackers and the\nstrong safety (red) step up hard",
           "the throw: the free safety\nhas carried the post",
           "caught behind the linebackers,\nin front of the deep corner"],
    lateral=(-20.5, 20.5), window=(-10.0, 30.0), rings=[("FS", PURPLE), ("SS", RED)])
Figure 50.6: A second-and-1 shot against Cover 3 (illustrative; frame strip in print, video on the website). The offense shows its run look: two tight ends (Y and U), the quarterback under center, the back behind him. The defense answers with base personnel and eight men within a few yards of the ball, the strong safety (red ring) walked down on the left; only the free safety (purple ring) is deep, with the two corners bailing to the deep outside thirds. (1) The snap. (2) The quarterback fakes the handoff, and the linebackers and the strong safety step up hard to stop a run that isn’t coming. (3) Eight players stay in to block (max protection; some teams release a tight end late as an outlet), and only two go out: X on a post from the left, Z on a deep over route from the right, the yankee concept from 04-04. The free safety can’t cover both; he carries the post, and the ball is thrown. (4) Z catches it about 18 yards downfield, behind the linebackers and in front of the deep corner. If the throw had fallen incomplete, it would be third-and-1.

The read in the strip is the Cover 3 read: one deep safety, two deep routes, and he can only carry one. Many defenses play this same eight-man, one-high look as Cover 1, man-to-man with the free safety deep. Yankee still works against it, but for a different reason: the over route becomes a crosser running away from the defender chasing him, and the quarterback reads the man, not the safety. Either way, it’s the eight-man box that makes the shot.

And when teams take the shot, it pays. On second-and-1-to-3 from 2021 to 2025, passes that traveled 15 or more yards in the air averaged +0.29 EPA per attempt, against +0.03 for runs and +0.10 for shorter throws. Yet only about 5% of second-and-short snaps were a deep throw (231 in five seasons of neutral situations).10 Two cautions belong next to those numbers. A deep-throw average only counts passes that were thrown, not the sacks taken while waiting for a deep route to open, so the true value of calling the shot is lower. And the shot is a constraint play: it works because the defense is leaning toward the run. If every offense threw deep on every second-and-1, defenses would stop leaning, and the number would shrink. The case the data makes is narrower and still strong: most offenses could take this shot more often than they do before it stopped paying.

CautionCommon misconception

“An incomplete shot on second-and-1 is a wasted down.” It’s a spent down, and it was the cheapest down the offense will have all game. The offense still has third-and-1, converted more than two times in three, with fourth-and-1 behind it in much of the field. Compare that with an incompletion on second-and-10, which leaves third-and-10 and a series that converts about a third of the time.

Why most teams still run on second-and-short

If the shot is that cheap and that good, why did offenses still run on 70% of second-and-shorts? Four reasons, and each one is real.

  • The run usually just wins. A designed run on second-and-1-to-3 gained the first down on the spot 66% of the time, and 79% on second-and-1. That’s a fresh set of downs with no third down at all, and every coach values never having to face one.
  • The shot is expensive to call. It needs a long run fake or a deep drop, eight men in protection and three seconds or more, which means only two receivers and a real chance of the drive-killing negative play from the on-schedule section. A sack turns second-and-1 into third-and-8, which is no longer cheap at all.
  • The risk weighs more than the reward. Romer’s asymmetry again: an interception on a shot is replayed all week, a stuffed run is forgotten by the next series.
  • The defense doesn’t always cooperate. Some defenses answer second-and-short with two deep safeties precisely to take the shot away, and then the right call is the run, into a lighter box.

Second-and-short isn’t the only shot box on a call sheet, either. Most staffs also keep shots for sudden change, the first snap after a takeaway, while the defense that just ran onto the field is still settling (08-03’s call sheet has a box for it); for the first first down after crossing midfield; and for coming out, which you’ll meet below.

The second down after an incompletion

One more second-down habit is worth knowing, because it’s a tendency you can see from your couch. Second-and-10 comes about two ways: after a first-down incompletion, or after a first-down run that gained nothing. Same down, same distance, so it should be the same call. It isn’t. From 2021 to 2025, offenses threw on 83% of second-and-10s that followed a no-gain run, and on only 56% of those that followed an incompletion. The pattern holds a yard or three shorter, too: on second-and-7-to-9, teams threw 73% of the time after a first-down run and 56% after a first-down pass.11

Play-callers alternate. After a pass that didn’t work, there’s a pull toward a run, to avoid two incompletions in a row and a third-and-10, and to “get back on track” with a sure few yards. After a run that didn’t work, the pull goes the other way. It’s exactly the habit that 08-02’s misconception box warned about: alternating is a pattern too. A truly unpredictable caller’s next call wouldn’t depend on his last one, because if it did, the defense could guess the next play from the last. Economists who studied NFL play-calling found the habit in the data, and found that it costs something: the habit made plays less effective.12 That’s why defensive coordinators chart it, and now you can too.

Field zones: the map on the call sheet

The down and distance tell a play-caller how much freedom he has. The yard line tells him what a mistake will cost and what success is worth, and the field is not uniform. Coaches divide it into zones, each with its own box on the call sheet:

Show the Python
LAT = (11.0, 42.3)
fig, ax = plt.subplots(figsize=(6.5, 3.7))
Field(ax=ax, orient="horizontal", los=60, window=None, to_go=None, numbers=False, hashes=False, lateral=LAT)
top, bot = LAT[1], LAT[0]
NAME_AT = {"backed up": 15.0, "coming out": 27.5, "open field": 52.5, "four-down\nterritory": 81.5,
           "red zone": 100.0}
PATCH = dict(boxstyle="round,pad=0.15", fc=style.SURFACE, ec="none", alpha=0.92)
SHOWN = {"backed up": "BACKED\nUP", "coming out": "COMING\nOUT", "open field": "OPEN FIELD",
         "four-down\nterritory": "FOUR-DOWN\nTERRITORY", "red zone": "RED ZONE"}
GOALS = {"backed up": "get out:\nno sack,\nno\nturnover", "coming out": "first first\ndown;\nflip the\nfield",
         "open field": "the whole menu;\nstay on schedule", "four-down\nterritory": "fourth down is\npart of the plan",
         "red zone": "touchdowns,\nnot field goals"}
for name, lo, hi in ZONES:
    x0, x1 = 110 - hi, 110 - lo
    ax.add_patch(Rectangle((x0, bot), x1 - x0, top - bot, fc=ZONE_COL[name], alpha=0.16, lw=0, zorder=0.5))
    fs = 6.6 if hi - lo <= 15 else 7.4
    ax.text(NAME_AT[name], (top + bot) / 2 + 5.0, SHOWN[name], ha="center", va="center", fontsize=fs,
            fontweight="bold", color=style.INK, linespacing=1.0, zorder=6, bbox=PATCH)
    ax.text(NAME_AT[name], (top + bot) / 2 - 5.0, GOALS[name], ha="center", va="center",
            fontsize=5.9 if hi - lo <= 15 else 6.3, color=style.INK_2, linespacing=1.05, zorder=6, bbox=PATCH)
ax.text(81.5, (top + bot) / 2 + 0.6, "(the fringe)", ha="center", va="center", fontsize=6.4, color=style.INK_2,
        zorder=6, bbox=PATCH)
# the open field crosses midfield: show its full extent so the strip past the 50 isn't an unnamed zone
ax.add_patch(FancyArrowPatch((35.6, (top + bot) / 2 + 5.0), (69.4, (top + bot) / 2 + 5.0), arrowstyle="|-|",
                             mutation_scale=3, color=style.OFFENSE_DARK, lw=0.9, zorder=5))
for x, lab in [(20, MINUS + "10"), (35, MINUS + "25"), (60, "50"), (70, "+40"), (90, "+20")]:
    ax.plot([x, x], [bot, top], color=style.INK_2, lw=1.0, zorder=3)
    ax.text(x, bot - 1.2, lab, ha="center", va="top", fontsize=7.2, color=style.INK, fontweight="bold")
for x, t in [(5, "YOUR\nEND ZONE"), (115, "THEIR\nEND ZONE")]:
    ax.text(x, (top + bot) / 2, t, rotation=90, ha="center", va="center", fontsize=6.3, color=style.INK_2)


def bracket(x0, x1, y, text, col=style.INK, fs=7.2):
    ax.plot([x0 + 0.4, x0 + 0.4, x1 - 0.4, x1 - 0.4], [y - 1.6, y, y, y - 1.6], color=col, lw=1.0, clip_on=False)
    ax.text((x0 + x1) / 2, y + 1.0, text, ha="center", va="bottom", fontsize=fs, color=col, clip_on=False,
            bbox=PATCH, zorder=7)


bracket(10, 60, top + 2.4, "minus territory: your half (" + MINUS + "1 to " + MINUS + "49)")
bracket(60, 110, top + 2.4, "PLUS TERRITORY: their half (+49 to +1)")
ax.plot([75, 75], [bot, top], color=style.INK, lw=1.0, ls=(0, (1, 1.5)), zorder=3)
ax.text(75.7, top - 1.4, "field-goal\nrange begins\n(about +35)", ha="left", va="top", fontsize=5.8, color=style.INK_2,
        zorder=6, linespacing=1.0, bbox=PATCH)
ax.plot([45], [bot + 1.8], marker="^", ms=6, color=style.INK, zorder=6)
ax.text(46.4, bot + 2.4, "kickoff\ntouchback", ha="left", va="center", fontsize=5.9, color=style.INK_2, zorder=6,
        linespacing=1.0, bbox=PATCH)
ax.text(45, bot - 1.2, MINUS + "35", ha="center", va="top", fontsize=6.4, color=style.INK_2)   # the touchback spot
ax.add_patch(FancyArrowPatch((38.0, top - 2.6), (56.0, top - 2.6), arrowstyle="-|>", mutation_scale=9,
                             color=style.OFFENSE, lw=1.5, zorder=6))
ax.text(47.0, top - 4.4, "offense moving this way", ha="center", va="top", fontsize=5.8, color=style.OFFENSE_DARK,
        zorder=6)
ax.set_ylim(bot - 5.5, top + 7.5)
plt.show()
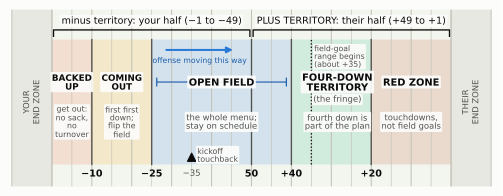
Figure 50.7: The field as a play-caller sees it, offense moving left to right. Coaches number yard lines in their own half with a minus sign and in the opponent’s half with a plus sign, so ‘minus 25’ is the offense’s own 25 and ‘plus 35’ the opponent’s 35. Backed up runs from the goal line to the minus 10; coming out to about the minus 25; the open field to about the plus 40; four-down territory (the fringe) from there to the plus 20; the red zone inside it. The lines between zones vary by staff and by situation; these are typical. The small triangle marks where a kickoff that lands in the end zone has been spotted since 2025, the minus 35, and the dotted line where field-goal range typically begins for an NFL kicker, around the plus 35. ‘Flip the field’ means turning a punt from deep in your own end into one that pins the opponent deep in theirs.

Here is each zone in plain words. The names are the common ones; exact boundaries vary by staff, and the same staff will move them with the weather, the kicker and the score.13

  • Backed up: inside your own 10. A sack in the end zone, or a holding penalty there, is a safety: two points and the ball for the other team. Even the punt is cramped. A punter normally stands 14 or 15 yards deep; with the ball at the 2, the end line is only 12 yards back, so he sets up a step in front of it, the snap arrives sooner, and a blocked punt is a safety or a touchdown (Kicking and Punting). Many staffs split this zone again: a tight box for the minus 1 to about the minus 4 or 5, where even under-center play-action is rare and the sneak and quick-hitting runs dominate, and the rest of the zone out to the minus 10. That’s why 08-03’s call sheet draws “backed up” at the 5 and this chapter draws it at the 10: both are in use.
  • Coming out: roughly your own 10 to your own 25. The emergency is over, but the offense still wants its first first down, which moves the ball away from its goal line and turns a short punt into a long one (“flipping the field”).
  • Open field: roughly your own 25 to the opponent’s 40. Field position neither forces the offense’s hand nor tempts it. Since 2025, a kickoff that lands in the end zone comes out to the 35, and about two drives in three now start at the offense’s own 25 or better.14
  • Plus territory: the opponent’s half. Coaches write yard lines there with a plus sign (“plus 35”) and in their own half with a minus sign (“minus 25”), so you’ll hear a coordinator say “we got the ball in plus territory” after a turnover, often followed by that sudden-change shot. The plus side isn’t one zone: it holds the last ten yards of the open field and the next two zones.
  • Four-down territory, which coaches also call the fringe: roughly the opponent’s 40 to its 20. A punt from here buys little field (a little too long and it’s a touchback at the 20), and a field goal is long or uncertain, so the offense plans on using fourth down if it needs it.
  • The red zone, from 01-02: inside the opponent’s 20, where the field compresses and drives cash in or settle for three. It has zones of its own (inside the 10, the goal line), which belong to The Red Zone, Goal Line, and Short Yardage.

How the call changes from zone to zone

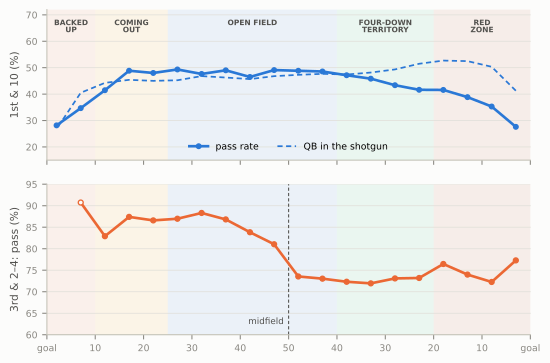
You can watch the zones change behavior in the data. The top half of the next chart is first-and-10 all the way down the field; the bottom half is third-and-2-to-4, the short distances where, as you’ll see, the yard line matters most.

Show the Python
def by5(df, col):
    d_ = df.copy()
    d_["b"] = ((d_.yardline_100.clip(1, 99) - 1) // 5) * 5 + 3          # bin centres 3, 8, ..., 98
    t_ = d_.groupby("b")[col].agg(["mean", "size"])
    return 110 - t_.index.values, t_["mean"].values, t_["size"].values


fig, (a1, a2) = plt.subplots(2, 1, figsize=(6.5, 4.4), sharex=True, gridspec_kw=dict(hspace=0.16))
f1 = N10[(N10.down == 1) & ((N10.ydstogo == 10) | (N10.goal_to_go == 1))]
for a in (a1, a2):
    shade_zones(a, alpha=0.08, labels=False)
x_, m_, n_ = by5(f1, "pass")
a1.plot(x_, m_ * 100, color=style.SERIES[0], lw=2, marker="o", ms=3.5, label="pass rate", zorder=3)
x_, m_, n_ = by5(f1, "shotgun")
a1.plot(x_, m_ * 100, color=style.SERIES[0], lw=1.3, ls=(0, (3, 2)), label="QB in the shotgun", zorder=3)
a1.set_ylim(15, 72)
a1.set_ylabel("1st & 10 (%)", fontsize=8)
a1.legend(loc="lower center", fontsize=7, ncol=2, bbox_to_anchor=(0.5, 0.0))
TOP_LAB = {"backed up": "BACKED\nUP", "coming out": "COMING\nOUT", "open field": "OPEN FIELD",
           "four-down\nterritory": "FOUR-DOWN\nTERRITORY", "red zone": "RED\nZONE"}
for name, lo, hi in ZONES:
    a1.text(110 - (lo + hi) / 2, 68.5, TOP_LAB[name], ha="center", va="top", fontsize=5.6, color=style.INK_2,
            fontweight="bold", linespacing=0.95)
t3b = N10[(N10.down == 3) & N10.ydstogo.between(2, 4)]
x_, m_, n_ = by5(t3b, "pass")
big = n_ >= 150
a2.plot(x_, m_ * 100, color=style.SERIES[1], lw=2, zorder=3)
a2.scatter(x_[big], m_[big] * 100, s=14, color=style.SERIES[1], zorder=4)
a2.scatter(x_[~big], m_[~big] * 100, s=14, facecolor=style.SURFACE, edgecolor=style.SERIES[1], zorder=4)
a2.axvline(60, color=style.INK_2, lw=0.8, ls=(0, (3, 2)))
a2.text(59, 62, "midfield", ha="right", va="bottom", fontsize=6.6, color=style.INK_2)
a2.set_ylim(60, 95)
a2.set_ylabel("3rd & 2–4: pass (%)", fontsize=8)
yardline_axis(a2)
for a in (a1, a2):
    a.tick_params(axis="y", labelsize=7)
    a.grid(axis="x", visible=False)
plt.show()
Figure 50.8: How the yard line changes the call, neutral situations, 2016-2025 regular seasons, offense moving left to right; each point is a 5-yard stretch of field. Top: on first-and-10 (first-and-goal inside the 10), how often the offense passed (blue) and how often its quarterback lined up in the shotgun (dashed). The pass rate is flat across the open field and falls off at both ends, backed up and near the opponent’s goal line; the shotgun disappears when the offense is backed up and, at the other end, only inside the 10. Bottom: on third-and-2-to-4, how often the offense passed. In its own half it threw about seven times in eight; past midfield the rate drops sharply, because fourth down is now part of the plan. Hollow points rest on fewer than 150 snaps. Source: nflverse play-by-play.

Backed up: get out, and don’t make it worse

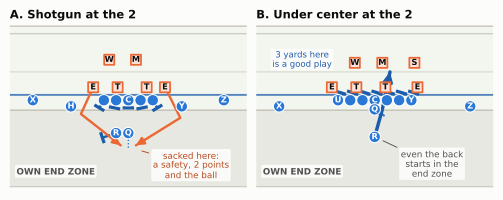
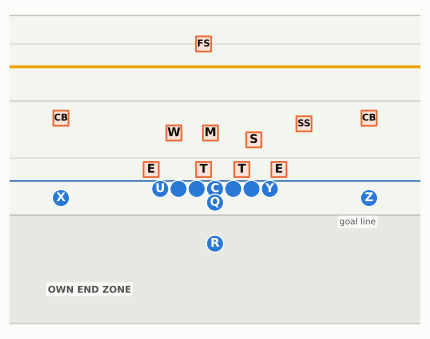
Inside its own 10, an offense changes character. On first-and-10 there, teams passed 33% of the time, against 49% in the open field, and their quarterbacks were in the shotgun on 36% of snaps, against 46%. The passes they did call were built not to be sacked: the sack rate on first-down dropbacks fell from 4.8% in the open field to 2.7% backed up, which means quick throws, play-action with extra blockers, and quarterbacks told to throw the ball away rather than take the loss.15 Even the throwaway has a limit down there. A quarterback still inside the tackle box who throws the ball to no one to dodge a sack is guilty of intentional grounding, and from his own end zone that’s a safety too. A legal throwaway needs him outside the tackle box with the ball reaching the line of scrimmage (Officiating, Replay, and the Rules of the Ball draws it), which is one more reason backed-up passes are either quick or rolled out to the edge.16 The picture shows why the shotgun in particular goes away.

Show the Python
def backed_up_panels():
    LOSb = 12.0      # BDB x of the offense's own 2-yard line
    fig, (ax1, ax2) = plt.subplots(1, 2, figsize=(6.5, 3.55), gridspec_kw=dict(wspace=0.04))
    # A: shotgun dropback
    off = line() + [O("QB", "QB", -5.0, 0.0, "Q"), O("RB", "RB", -5.0, -1.6, "R"), O("Y", "TE", -1.5, 7.0, "Y"),
                    O("H", "WR", -1.5, -7.5, "H"), O("X", "WR", -0.7, -12.5, "X"), O("Z", "WR", -0.7, 12.5, "Z")]
    dfn = [D("LE", "DE", 1.0, -4.6, "E"), D("LT_", "DT", 1.0, -1.4, "T"), D("RT_", "DT", 1.0, 2.4, "T"),
           D("RE", "DE", 1.0, 4.8, "E"), D("MIKE", "MIKE", 4.6, 1.0, "M"), D("WILL", "WILL", 4.6, -2.5, "W")]
    p = Play(off, dfn, los=LOSb, to_go=10)
    for k, w in zip(["LT", "LG", "C", "RG", "RT"], (-0.6, -0.2, 0.0, 0.2, 0.6)):
        p.block(k, pts=[(-1.0, w)])                     # pass sets
    p.block("RB", pts=[(-0.6, -1.8)])                   # the back stays in to protect
    p.dropback(2.0)
    p.rush("LE", pts=[(-3.5, -1.6), (-7.6, 3.6)])       # edge rushers loop to the quarterback
    p.rush("RE", pts=[(-4.0, 2.0), (-7.6, -3.8)])
    f1 = draw(p, ax=ax1, lateral=(-15.0, 15.0), window=(-12.0, 9.0))
    panel_title(ax1, "A. Shotgun at the 2")
    say(f1, p, -10.0, -9.5, "OWN END ZONE", fontsize=6.6, weight="bold")
    point_to(f1, p, (-9.2, 8.2), (-7.0, 0.6), "sacked here:\na safety, 2 points\nand the ball",
             color=style.DEFENSE_DARK)
    # B: under center, two tight ends, a handoff going forward
    off = line() + [O("QB", "QB", -1.9, 0.0, "Q"), O("RB", "RB", -5.5, 0.0, "R"), O("Y", "TE", -0.7, 4.8, "Y"),
                    O("U", "TE", -0.7, -4.8, "U"), O("X", "WR", -1.5, -12.5, "X"), O("Z", "WR", -1.5, 12.5, "Z")]
    dfn2 = [D("LE", "DE", 1.0, -5.6, "E"), D("LT_", "DT", 1.0, -2.4, "T"), D("RT_", "DT", 1.0, 1.4, "T"),
            D("RE", "DE", 1.0, 5.6, "E"), D("MIKE", "MIKE", 4.2, 1.0, "M"), D("WILL", "WILL", 4.2, -2.6, "W"),
            D("SAM", "SAM", 4.2, 5.2, "S")]
    q = Play(off, dfn2, los=LOSb, to_go=10)
    for k in ["LT", "LG", "C", "RG", "RT", "U", "Y"]:
        q.block(k, pts=[(1.0, 0.3)])
    q.path("QB", [(-0.8, 1.2)], speed=3.0)
    q.run("RB", [(3.6, 1.0), (8.5, 2.0)])
    q.handoff("RB", t=0.75)
    f2 = draw(q, ax=ax2, lateral=(-15.0, 15.0), window=(-12.0, 9.0))
    panel_title(ax2, "B. Under center at the 2")
    say(f2, q, -10.0, -9.5, "OWN END ZONE", fontsize=6.6, weight="bold")
    point_to(f2, q, (-9.0, 7.5), (-5.5, 0.0), "even the back\nstarts in the\nend zone", color=style.INK_2)
    say(f2, q, 4.6, -9.5, "3 yards here\nis a good play", fontsize=6.4, color=style.OFFENSE_DARK)
    return fig


backed_up_panels()
plt.show()
Figure 50.9: First-and-10 at the offense’s own 2 (illustrative). Left: from the shotgun, the quarterback takes the snap five yards behind the ball, three yards deep in his own end zone, and a normal dropback takes him deeper still. Any sack there is a safety, and so is a holding penalty by a blocker in the end zone. Right: under center, with two tight ends, the quarterback takes the snap just in front of his goal line and hands off going forward; even the running back, who lines up in the end zone, gets the ball near the goal line moving out. The call that gets three yards safely is worth more here than the call that might get twenty.

Here’s the puzzle: by EPA, the run is a worse bet backed up than anywhere else on the field (you’ll see it in the EPA chart at the end of the chapter), and the pass still comes out ahead on average, sacks and safeties included. Why run anyway? Partly the averages again: the backed-up passes that teams do call are the safe, quick, well-protected kind, chosen precisely because they rarely end in disaster, and a defense that expected more of them would make them harder. Partly the objective is different. Backed up, the first goal isn’t a big gain, it’s getting out: a few yards so the punter can stand at his normal depth, a first down so the next series starts with room. And partly it’s the asymmetry Romer described: a safety or an interception at your own 5 loses a game in a way a three-yard run never does. Backed-up football is the most conservative football you’ll see all day, and for most teams it’s also their least productive: on first-and-10 inside the 10, plays succeeded only 35% of the time, against 43% in the open field.

Coming out: the first first down

From its own 10 to about its own 25, an offense’s priority is the first first down, and you can put a number on why. From 2021 to 2025, after a punt from the offense’s own 10 to 15, the opponent’s next drive started, on average, at its own 43; after a punt from the own 25 to 30, at its own 28.17 One first down before the punt is worth about 15 yards of the opponent’s field position: that’s what “flipping the field” buys. You’ll see play-callers here lean on their most reliable first-down calls, the ones they trust not to go backward, but you’ll also see the quarterback come back out in the shotgun and a normal pass rate return: first-and-10 in this zone was a pass 47% of the time, against 33% backed up and 49% in the open field. Some staffs also keep a box of play-action shots for this zone, because defenses that just watched a backed-up offense run three times in a row are expecting a fourth.

The open field: the whole menu

From your own 25 out to about the opponent’s 40, the yard line stops mattering much. First-and-10 pass rates are flat across the whole stretch, and so are shotgun rates. This is where the base plays live, where sequencing does its work and where a play-caller’s balance on first down earns its keep. If you want to learn an offense’s personality, watch it here: the open field is where coaches call what they like, not what the field forces on them.

Plus territory and four-down territory: one more down to spend

Cross midfield and something changes that you can’t see on the field: the offense gains a down. Not officially, but in practice, because once a punt buys little and the kick is long, most offenses now plan to go for it on fourth-and-short. In 2025 teams went for it on 77% of fourth-and-1-to-3s between midfield and the opponent’s 21, against 33% in their own half between their 21 and midfield (outside the last two minutes of each half).18 Is going that often right? Public fourth-down models, such as Ben Baldwin’s open-source nfl4th, generally favor going for it on fourth-and-short across most of this part of the field, so the rise mostly reflects teams catching up with the math; The Clock, the Two-Minute Drill, and Fourth Down prices the decision case by case.19

The extra down changes third down. Look at third-and-2-to-4 first. (Third-and-1 is a running down everywhere, the quarterback sneak alone sees to that: offenses threw on only 24% of them, wherever the ball was. So the yard line’s effect shows a yard or three further out.) In its own half, an offense facing third-and-2-to-4 threw 86% of the time; past midfield, 73%. It is still a passing down, but the run comes back into play: with a fourth down in hand, third-and-3 becomes the first of two tries, and a run that gains two yards is no longer a failure, because it sets up fourth-and-1. Notice in the bottom panel of the chart where the switch flips: right at midfield, a little earlier than the “plus 40” that the textbook definition of four-down territory uses. On short yardage, today’s NFL treats the whole plus side as four-down territory.

NoteFilm room: Detroit Lions, 2023–2024

The seasons: Ben Johnson’s last two years as Detroit’s offensive coordinator under head coach Dan Campbell. The Lions went 12–5 in 2023 and reached the NFC Championship Game, losing 34–31 in San Francisco; in 2024 they went 15–2, took the NFC’s top seed, and led the league with 564 points before losing to Washington in the divisional round.20

What to notice, part 1: balanced and efficient. On early downs in neutral situations the Lions passed less often than most of the league (24th in 2023, 23rd in 2024) and were 5th and 6th in EPA per play. Like the 2018 Rams, they ran and faked from the same looks, so their run rate was a weapon rather than a price (Constraint Theory has their tendency table).

What to notice, part 2: they used the extra down. Campbell’s Lions were among the league’s most committed users of four-down territory. They went for it on fourth down 40 times in 2023 (2nd most in the league) and 33 times in 2024 (4th), converting 21 and 22. The fourth-down decision itself, and when it pays, is in The Clock, the Two-Minute Drill, and Fourth Down; the whole Detroit era is a case study.

The fringe of field-goal range, and the red zone

Somewhere around the opponent’s 35, a drive enters field-goal range, and the cost of a negative play changes again. A field goal is the yard line plus about 18 (the kick is spotted 8 yards behind the line, and the posts stand 10 yards deep, on the end line), so a sack at the plus 33 doesn’t just cost a down and seven yards; it can turn a 51-yard field goal into a 58-yarder or a punt. That’s why you’ll see quarterbacks near the edge of range throw the ball away rather than hold it, and play-callers avoid slow-developing dropbacks on third-and-long there: three points in hand are worth more than a small chance at a first down.

That line is moving outward. NFL kickers tried 266 field goals of 50 yards or more in 2025, against 150 in 2016, and made 69% of them, up from 57%.21 With a strong-legged kicker, “range” can start near the plus 40, and four-down territory shrinks with it, which is one reason the boundaries on the map are drawn loosely.

Inside the 20, the field shrinks. The back of the end zone works like an extra defender, there’s no room to throw over the top, and both pass rates and shotgun rates fall again as the goal line nears. How offenses and defenses play that compressed field is the next chapter but one, The Red Zone, Goal Line, and Short Yardage.

The defense reads the same map

This section has been told from the offense’s side, but the defensive coordinator’s call sheet carves up the same field. Backed up, the defense is the aggressive side: it expects a run or a quick throw, crowds the line, and is happy to pressure, because a sack or a holding flag might be a safety and even a short punt hands it good field position. In the open field it plays its base calls and its tendencies. In four-down territory a stop on third down isn’t a stop yet, so the defense is really defending two short-yardage snaps, and its third-down call can’t sell out against the run or the pass. Near the edge of field-goal range a sack is worth more than usual, because it can push the offense out of range. And on second-and-short, as the shot section showed, it mostly answers the offense’s personnel. The defense’s half of these situations gets its full treatment in the rest of Part 10.

Reading the numbers: down, distance, and yard line

You’ve now seen the pieces one at a time. Two charts put them together, and they are the kind of chart you’ll meet in every analytics article about play-calling. Here is how to read them.

Show the Python
H = N5[N5.down <= 3].copy()
H["dist"] = H.ydstogo.clip(upper=15).astype(int)
HP = H.pivot_table(index="down", columns="dist", values="pass", aggfunc="mean")
HN = H.pivot_table(index="down", columns="dist", values="pass", aggfunc="size")
cmap = LinearSegmentedColormap.from_list("pr", [style.DEFENSE, "#fbe3d6", "#f6f4ee", style.OFFENSE_TINT,
                                                style.OFFENSE])
fig, ax = plt.subplots(figsize=(6.5, 2.35))
for i, dn in enumerate([1, 2, 3]):
    for j, dist in enumerate(range(1, 16)):
        v, nn = HP.loc[dn, dist], HN.loc[dn, dist]
        rare = nn < 150
        ax.add_patch(Rectangle((j, 2 - i), 0.95, 0.92, fc=style.GRID if rare else cmap(float(v)), ec="white", lw=1.2))
        dark = (not rare) and (v >= 0.9 or v <= 0.15)      # white text only on the deepest cells
        ax.text(j + 0.475, 2 - i + 0.46, "·" if rare else f"{v * 100:.0f}", ha="center", va="center",
                fontsize=7.4, fontweight="bold", color="white" if dark else style.INK)
ax.set_xlim(-0.05, 15); ax.set_ylim(-0.05, 3)
ax.set_xticks([j + 0.475 for j in range(15)], [str(k) for k in range(1, 15)] + ["15+"], fontsize=7.2)
ax.set_yticks([2.46, 1.46, 0.46], ["1st down", "2nd down", "3rd down"], fontsize=7.8)
ax.xaxis.tick_top()
ax.xaxis.set_label_position("top")
ax.set_xlabel("Yards to go  (numbers are the % of snaps that were passes)", fontsize=7.6, labelpad=6)
ax.tick_params(length=0); ax.grid(False)
for sp in ax.spines.values():
    sp.set_visible(False)
plt.show()
Figure 50.10: How often offenses passed, by down (rows) and exact yards to go (columns, 15 or more grouped), neutral situations, 2021-2025 regular seasons. Blue cells lean pass, orange cells lean run; grey cells had fewer than 150 snaps. First down is almost always first-and-10; its other cells are mostly first-and-goal inside the 10 and first downs after a penalty. Read across a row to see how fast the pass takes over as the distance grows, and down a column to see what each lost down does at the same distance. Two details are real, not noise: second-and-10 is a less pass-heavy cell than second-and-9 (it usually follows an incompletion), and the 1-yard column is run-heavy on every down. Source: nflverse play-by-play.

A heatmap like this answers “what does the situation predict?” It shows the league’s habits, not what’s right. Three habits stand out. Across the second-down row, the pass takes over steadily from about second-and-4. Down the 1-yard column, the run dominates on every down. And across the third-down row, the switch is nearly instant: by third-and-4 almost everybody throws. Every one of those habits is a tendency a defense can lean on, which is why the interesting calls are the ones that land in the “wrong” color.

Show the Python
E = N10.copy()
E["b10"] = ((E.yardline_100.clip(1, 99) - 1) // 10) * 10 + 5
# third-and-short is thinner, so it is binned by field zone (the zone's middle yard line) instead
E["bz"] = E.yardline_100.map(lambda y: next((lo + hi) / 2 for _, lo, hi in ZONES if lo < y <= hi))
panels = [("1st & 10", E[(E.down == 1) & ((E.ydstogo == 10) | (E.goal_to_go == 1))]),
          ("2nd down", E[E.down == 2]), ("3rd & 1–3", E[(E.down == 3) & (E.ydstogo <= 3)])]
fig, axes = plt.subplots(1, 3, figsize=(6.5, 2.8), sharey=True, gridspec_kw=dict(wspace=0.08))
for a, (title, sub) in zip(axes, panels):
    shade_zones(a, alpha=0.08, labels=False)
    col_ = "bz" if title.startswith("3rd") else "b10"
    t_ = sub.groupby([col_, "pass"]).epa.mean().unstack()
    n_ = sub.groupby([col_, "pass"]).epa.size().unstack()
    t_ = t_.where(n_ >= 150)                    # leave out stretches with too few snaps to trust
    for k, col, lab in [(0, style.SERIES[1], "designed runs"), (1, style.SERIES[0], "dropbacks")]:
        a.plot(110 - t_.index.values, t_[k].values, color=col, lw=1.8, marker="o", ms=3, label=lab, zorder=3)
    a.axhline(0, color=style.BASELINE, lw=1)
    a.set_title(title, fontsize=8.6)
    a.set_xlim(10, 110)
    a.set_xticks([20, 40, 60, 80, 100], [MINUS + "10", MINUS + "30", "50", "+30", "+10"], fontsize=6.6)
    a.tick_params(axis="y", labelsize=7)
    a.grid(axis="x", visible=False)
axes[0].set_ylabel("EPA per play", fontsize=8)
axes[0].set_ylim(-0.25, 0.25)
axes[1].legend(loc="lower center", fontsize=7, ncol=2, bbox_to_anchor=(0.5, -0.36))
plt.show()
EF = {t: s.groupby(["b10", "pass"]).epa.mean().unstack() for t, s in panels}
Figure 50.11: What runs and dropbacks earned across the field, neutral situations, 2016-2025 regular seasons: EPA per play for designed runs (orange) and dropbacks (blue), by 10-yard stretch of field, offense moving left to right. On first and second down the dropback line sits above the run line almost everywhere; the gap is widest when the offense is backed up and closes near the opponent’s goal line, where the field is short and a run is as good as a pass. Third-and-1-to-3 is shown instead of all third downs so that runs and passes face the same distances; it is thinner, so each point there is a whole field zone. Runs have earned about as much as dropbacks or more, and clearly more in the red zone. Points resting on fewer than 150 snaps of either kind are left out, which is why the backed-up end of that panel is empty. Source: nflverse play-by-play.

A chart like this answers a different question: “what did each choice earn?” Read it in three steps. First, find the gap between the lines: on early downs the pass has earned more almost everywhere, by the most when the offense is backed up, where teams run the most. Second, find where the lines meet: close to the opponent’s goal line, where the defense has no deep space to protect and a run is as good as a pass. Third, remember what the chart can’t see. Every point mixes situations (the backed-up passes are the safe ones; the third-and-short runs include quarterback sneaks, the best short-yardage play in football), and every point is an average of what teams chose to do, not of what they would have earned doing more of it. The gap is a strong hint about where offenses are too cautious. It isn’t a play-call.

TipWatch for it on Sunday: the situation tag

This is the 01-02 forecaster, upgraded with the field. For one half of one game, before every snap:

  • Say the tag out loud: the down-and-distance bucket plus the zone. “Second and short, open field.” “First and ten, backed up.” “Third and three, four-down territory.”
  • Predict run or pass from the tag, then glance at the formation and change your guess if it tells you something. Mark both.
  • Flag the four situations this chapter gave you an edge in: second-and-10 after an incompletion (less pass than usual, though still slightly more likely a pass); second-and-short with one deep safety and eight defenders near the ball (shot alert: count the deep safeties before the snap); backed up (count the shotgun snaps, and expect a quick throw or a run); third-and-2-to-4 past midfield (still usually a pass, but the run comes back into play, and expect a fourth-down try if it fails).
  • At halftime, score yourself by tag, not just overall. You should be very good on third-and-long and second-and-very-long, decent backed up and in the red zone, and close to a coin flip on first-and-10 and second-and-medium. That isn’t a failure: first-and-10 is built to beat you.

What “good” looks like: the table below is what you’d score by always guessing the more common call for each tag, in neutral situations from 2021 to 2025. First-and-10 is split by the five zones; second down by its four buckets; third down by the cuts this chapter used (third-and-1 anywhere, third-and-2-to-4 on each side of midfield, and everything longer). Overall, that simple rule was right 66% of the time. Beat it on any tag and you’re reading something the down and distance alone don’t show.

Show the Python
rows = "| Tag | Pass rate | Guess | Right |\n|---|---:|:---:|---:|\n"
for t in TAG_ORDER:
    r_ = TAG_T.loc[t]
    rows += f"| {t} | {pct(r_.pr)} | {r_.guess} | {pct(r_.acc)} |\n"
display(Markdown(rows))
Table 50.1: The situation tags and how predictable each one was, neutral situations, 2021-2025 regular seasons: the share of snaps that were passes, the more common call, and how often guessing that call would have been right. Source: nflverse play-by-play.
Tag Pass rate Guess Right
1st & 10, backed up 33% run 67%
1st & 10, coming out 47% run 53%
1st & 10, open field 48% run 52%
1st & 10, four-down territory 44% run 56%
1st & 10 (or goal), red zone 35% run 65%
2nd & short (1–3) 30% run 70%
2nd & medium (4–6) 50% pass 50%
2nd & long (7–10) 67% pass 67%
2nd & very long (11+) 82% pass 82%
3rd & 1, anywhere 23% run 77%
3rd & 2–4, own half 84% pass 84%
3rd & 2–4, their half 69% pass 69%
3rd & 5 or more 95% pass 95%

Predict the play

TipPredict the play 1: first-and-10 at your own 3
Show the Python
LOS1 = 13.0
off = line() + [O("QB", "QB", -1.9, 0.0, "Q"), O("RB", "RB", -5.5, 0.0, "R"), O("Y", "TE", -0.7, 4.8, "Y"),
                O("U", "TE", -0.7, -4.8, "U"), O("X", "WR", -1.5, -13.5, "X"), O("Z", "WR", -1.5, 13.5, "Z")]
dfn = [D("WDE", "DE", 1.0, -5.6, "E"), D("WDT", "DT", 1.0, technique("2i", -1), "T"),
       D("SDT", "DT", 1.0, technique("3", 1), "T"), D("SDE", "DE", 1.0, 5.6, "E"),
       D("SAM", "SAM", 3.6, 3.4, "S"), D("MIKE", "MIKE", 4.2, -0.4, "M"), D("WILL", "WILL", 4.2, -3.6, "W"),
       D("SS", "SS", 5.0, 7.8, "SS"), D("LCB", "CB", 5.5, -13.5, "CB"), D("RCB", "CB", 5.5, 13.5, "CB"),
       D("FS", "FS", 12.0, -1.0, "FS")]
p1 = Play(off, dfn, los=LOS1, to_go=10)
f_ = draw(p1, lateral=(-17.5, 17.5), window=(-12.5, 14.5), width_in=5.6)
say(f_, p1, -9.5, -11.0, "OWN END ZONE", fontsize=7.0, weight="bold")
say(f_, p1, -3.6, 12.5, "goal line", fontsize=6.4)
plt.show()
Figure 50.12: First-and-10 at the offense’s own 3, second quarter, tied 7-7. The offense has two tight ends (Y and U) and a running back (R) in its own end zone, with the quarterback (Q) under center. The defense has seven men within five yards of the ball and the strong safety (SS) walked down outside the right tight end: eight near the line of scrimmage, one safety (FS) deep.

Run or pass? And name two calls this offense is very unlikely to make.

Most likely a run, from exactly this kind of look; very unlikely: a shotgun dropback, or any play that asks the quarterback to hold the ball.

On first-and-10 inside their own 10, offenses in neutral situations passed only 33% of the time (2016–2025), against 49% in the open field. Two tight ends with the quarterback under center make a run more likely still. But even this run isn’t safe by default: the quarterback takes the snap in the field of play, and the handoff comes right around the goal line, so a defensive tackle who knifes into the backfield can make the tackle at the mesh for a safety. That’s why, backed up this tight, staffs cheat the back up a yard or two (he’s only two and a half yards deep in the end zone here) and call downhill runs that hit fast: a dive, an iso, duo, the quarterback sneak.

The calls to cross off are the ones that keep the ball behind the goal line for a long time: the quarterback in the shotgun (he’d start three yards deep in his own end zone), a deep dropback, a pass that needs four seconds to develop, and any run with a deep mesh or a long sideways path (a stretch, a toss, a counter with pulling linemen), which might be caught going sideways in the end zone. A sack or a holding penalty in the end zone is two points and the ball.

The surprise you’ll occasionally see: a play-action shot from this exact look, with both tight ends and the back staying in to block, because eight defenders near the line and one deep safety is exactly the picture a shot is built to beat. It is rare, and when it hits it can go 90-plus yards. The defense knows the odds, which is why it walked the strong safety down: it’s betting on the run, and accepting the risk of the shot.

TipPredict the play 2: second-and-10 after an incompletion
Show the Python
LOS2 = 45.0
off = line() + [O("QB", "QB", -5.0, 0.0, "Q"), O("RB", "RB", -5.0, -1.6, "R"), O("Y", "TE", -0.7, 4.8, "Y"),
                O("H", "WR", -1.5, -8.0, "H"), O("X", "WR", -0.7, -14.5, "X"), O("Z", "WR", -1.5, 14.0, "Z")]
dfn = [D("WDE", "DE", 1.0, -4.6, "E"), D("WDT", "DT", 1.0, technique("2i", -1), "T"),
       D("SDT", "DT", 1.0, technique("3", 1), "T"), D("SDE", "DE", 1.0, technique("6", 1) + 0.6, "E"),
       D("MIKE", "MIKE", 5.0, 1.8, "M"), D("WILL", "WILL", 5.0, -2.2, "W"), D("NB", "NB", 5.0, -8.5, "$"),
       D("LCB", "CB", 7.0, -14.5, "CB"), D("RCB", "CB", 7.0, 14.0, "CB"),
       D("FS", "FS", 12.5, -8.0, "FS"), D("SS", "SS", 12.5, 8.0, "SS")]
p2 = Play(off, dfn, los=LOS2, to_go=10)
f_ = draw(p2, lateral=(-18.5, 18.5), window=(-9.5, 15.0), width_in=5.6)
say(f_, p2, -6.2, -11.5, "last play: 1st & 10,\npass incomplete", fontsize=6.6)
plt.show()
Figure 50.13: Second-and-10 at the offense’s own 35, first quarter, tied. On first down the quarterback threw incomplete. The offense is in the shotgun with three receivers and a tight end (11 personnel), the back (R) beside the quarterback. The defense is in its nickel (five defensive backs) with two deep safeties: only six defenders are in the box, inside the tight end and within five yards of the ball.

Is a pass more or less likely here than on a typical second-and-10? What does the previous play tell you, and what does the defense tell you?

Less likely than usual: still a pass more often than not, but only barely (56%), against 83% when the same second-and-10 follows a no-gain run.

Second-and-10 is usually a passing down, but which second-and-10 matters. From 2021 to 2025, offenses threw on 83% of second-and-10s that followed a no-gain run and on only 56% of those that followed an incompletion (4,179 snaps). After a failed pass, play-callers lean toward a run to avoid two straight incompletions and a third-and-10.

The defense adds a second reason. Two deep safeties and a nickel back leave six defenders in the box against six blockers (five linemen and the tight end), a light box that is all but inviting a run. Many offenses build this answer into the play itself, with a run-pass option or a quarterback check at the line: against six in the box, hand it off. The defense, for its part, knows that four or five yards here are not a disaster for it; what it can’t allow is the explosive pass that a single-high shell would risk.

If a pass does come, expect something quick that gets half the distance back: a 5-yard completion turns the down into third-and-5.

TipPredict the play 3: third-and-3 at the opponent’s 38
Show the Python
LOS3 = 72.0
off = line() + [O("QB", "QB", -4.0, 0.0, "Q"), O("RB", "RB", -7.0, 0.0, "R"), O("Y", "TE", -0.7, 4.8, "Y"),
                O("H", "WR", -1.5, -8.0, "H"), O("X", "WR", -0.7, -14.5, "X"), O("Z", "WR", -1.5, 14.0, "Z")]
dfn = [D("WDE", "DE", 1.0, -4.6, "E"), D("WDT", "DT", 1.0, technique("2i", -1), "T"),
       D("SDT", "DT", 1.0, technique("3", 1), "T"), D("SDE", "DE", 1.0, technique("6", 1) + 0.8, "E"),
       D("MIKE", "MIKE", 4.5, 1.6, "M"), D("WILL", "WILL", 4.5, -2.0, "W"), D("NB", "NB", 4.5, -8.5, "$"),
       D("SS", "SS", 6.0, 8.5, "SS"), D("LCB", "CB", 6.0, -14.5, "CB"), D("RCB", "CB", 7.0, 14.0, "CB"),
       D("FS", "FS", 13.0, 0.0, "FS")]
p3 = Play(off, dfn, los=LOS3, to_go=3)
f_ = draw(p3, lateral=(-18.5, 18.5), window=(-10.0, 16.0), width_in=5.6)
plt.show()
Figure 50.14: Third-and-3 at the opponent’s 38 (plus territory), second quarter, tied. The offense is in the pistol (the quarterback about four yards behind the ball with the back directly behind him) with three receivers and a tight end. The defense is in its nickel with one deep safety: six defenders in the box, with the nickel back ($) and the strong safety (SS) close enough to fill against a run.

Run or pass? Would your answer change if this were third-and-3 at the offense’s own 38?

Still more likely a pass, about three times in four, but a run is far more likely than it would be in the offense’s own half, and if it fails, expect the offense to stay on the field for fourth down.

On third-and-2-to-4 from 2016 to 2025, offenses threw 86% of the time in their own half and 73% of the time past midfield. The yard line is the reason. At the opponent’s 38 a punt buys little and a field goal would be 56 yards (38 plus 18), so most offenses plan to use fourth down: in 2025 teams went for it on 77% of fourth-and-1-to-3s between midfield and the opponent’s 21. That makes this third down the first of two tries, and a run that gains two yards isn’t a failure; it sets up fourth-and-1. The pistol helps the run here too: the back gets the ball going downhill, and the quarterback can keep it.

It also explains why the conversion rate on these third downs barely changes between the two halves of the field (54% in the offense’s own half, 56% past midfield): the run isn’t a worse call, just a different one. At its own 38, with a punt coming if it fails, the offense would probably throw, about six times in seven, and the defense would know it.

Takeaways

  • The situation comes before the play. A call sheet is organized by down and distance, field zone, and score and clock. On the early downs (first and second) nothing is forced, which is why they are where a play-caller’s philosophy shows.
  • First-and-10 is a coin flip, on purpose. Neutral first-down pass rates have sat near 46% for a quarter century, even though dropbacks have out-earned runs there every season. Balance keeps the defense guessing; the price is the gap. Good offenses shrink the price; they don’t abandon balance.
  • “Establish the run” is four claims. Running doesn’t measurably wear defenses down, play-action doesn’t need a successful run game, and teams run a lot because they’re winning, not the reverse. What survives: a run game the defense must respect makes the passing game better, and an efficient run game (2019 Ravens) is worth calling often.
  • Stay on schedule. About 4 yards on first down is the line between a series that usually converts and one that often doesn’t. The play that kills drives is the negative play, not the incompletion.
  • Second down comes in four buckets, and second-and-short is the cheapest down in football to spend on a shot: a failed shot costs about half what a wasted second-and-long does. Teams still mostly run there, because the run usually moves the chains and the shot carries sack and turnover risk; when they do take the shot, it usually pays. And the second-and-10 after an incompletion is less of a passing down than its down and distance say.
  • The field has zones. Backed up, offenses get conservative and leave the shotgun; coming out, they chase the first first down that flips the field; in the open field the whole menu is available; past midfield, fourth down becomes part of the plan, and on third-and-short the run comes back into play.

Connections

Builds on: Downs, Distance, and Field Position (the buckets, the third-down price list, expected points and EPA, the red zone) and Constraint Theory (base and constraint plays, tendencies). The play-action evidence comes from Play-Action, Bootlegs, and Screens, the yankee concept from Dropback Concepts, and the selection-effect warning from A First Look at Defense, which Expected Points, EPA, and Success Rate develops.

Sets up: the rest of Part 10 zooms in on the situations this chapter mapped: Third Down: The Money Down, The Red Zone, Goal Line, and Short Yardage, and The Clock, the Two-Minute Drill, and Fourth Down, which adds the score and the clock and prices the fourth-down decision this chapter keeps pointing at. Tendencies: PROE, Personnel, Motion, and Coverage turns “how often they pass here” into pass rate over expected, and The Game Plan shows the call sheet these situations organize. Case studies: the Ravens’ Lamar Jackson run game, Andy Reid’s Chiefs and the Lions under Ben Johnson and Dan Campbell.

NoteGo deeper
  • Pat Kirwan with David Seigerman, Take Your Eye Off the Ball 2.0 (Triumph Books, 2015): a former NFL assistant coach, scout and front-office executive on how down, distance and field position organize what both sides do, and how to watch for it.
  • The nflfastR documentation (https://www.nflfastr.com/) and the Open Source Football site (https://www.opensourcefootball.com/): the play-by-play data and models behind every chart here, and many reader-written analyses of early-down passing.
  • Brian Burke, “Game Theory and Run/Pass Balance,” Advanced NFL Stats (June 2008), http://archive.advancedfootballanalytics.com/2008/06/game-theory-and-runpass-balance.html: run-pass balance as a game of mixed strategies, and the clearest popular case for why “balance” and “efficiency” are both right.
  • David Romer, “Do Firms Maximize? Evidence from Professional Football” (2006), cited below: the paper that started the modern argument about coaching conservatism.

  1. Course calculation from nflverse play-by-play, regular seasons 1999–2025: called runs and passes (sacks and scrambles count as passes) in neutral situations (outside the last two minutes of each half, win probability 20–80%). EPA per play is nflverse’s.↩︎

  2. David Romer, “Do Firms Maximize? Evidence from Professional Football,” Journal of Political Economy 114, no. 2 (2006): 340–365, https://eml.berkeley.edu/~dromer/papers/JPE_April06.pdf . Romer studied fourth downs in the 1998–2000 seasons and found choices systematically more conservative than the ones that maximized the chance of winning; one explanation he offers is that decision makers weigh the losses from failed gambles more heavily than the gains from successful ones.↩︎

  3. Course calculation from nflverse play-by-play, 2016–2025 regular seasons: designed runs and dropbacks on first and second down in neutral situations, EPA per play by quarter.↩︎

  4. Course calculation from nflverse play-by-play: every regular-season team-game from 2016 to 2025 (5,258 of them after leaving out ties). Designed runs are called runs, which include quarterback runs but not kneel-downs or scrambles. Correlations with winning (1 = won, 0 = lost): total runs 0.49, first-half early-down run rate 0.03, fourth-quarter run rate 0.67. The point that rushing totals follow the score rather than cause it is an old one in football analytics; for the game-theory side of run-pass balance, see the Brian Burke essay listed under “Go deeper”.↩︎

  5. Records and points from nflverse schedules (load_schedules), checked against Pro Football Reference: https://www.pro-football-reference.com/years/2018/ . Ranks for early-down pass rate and EPA are a course calculation (neutral situations, first and second down).↩︎

  6. Course calculation: nflverse participation data for 2018 (load_participation, from NFL Next Gen Stats), joined to regular-season runs and passes in nflverse play-by-play; personnel counted from the offense_personnel field. The first-and-10 pass rates by season are the chapter’s own calculation (neutral situations, as in the first chart).↩︎

  7. Rams 54, Chiefs 51, Monday, November 19, 2018, Los Angeles Memorial Coliseum (nflverse game 2018_11_KC_LA; passing yards, touchdowns and the three defensive touchdowns from its play-by-play: Samson Ebukam’s fumble return and interception return for the Rams, Allen Bailey’s fumble return for the Chiefs). The game was scheduled for Estadio Azteca in Mexico City; on Tuesday, November 13, the league moved it after an inspection found the re-sodded Azteca surface did not meet NFL standards for playability and consistency: NFL.com, “Chiefs-Rams game moved from Mexico City to Los Angeles” (November 13, 2018), https://www.nfl.com/news/chiefs-rams-game-moved-from-mexico-city-to-los-angeles-0ap3000000988000 ; CBS Sports, “NFL moves Chiefs-Rams game from Mexico City to Los Angeles due to poor field conditions,” https://www.cbssports.com/nfl/news/nfl-moves-chiefs-rams-game-from-mexico-city-to-los-angeles-due-to-poor-field-conditions/ .↩︎

  8. Pro Football Reference, 2019 Baltimore Ravens: https://www.pro-football-reference.com/teams/rav/2019.htm (14–2, 531 points); the 3,296 rushing yards broke the 1978 New England Patriots’ NFL record of 3,165 in Week 17 and still stood after the 2025 season: NFL.com, “Ravens break single-season team rushing record” (December 29, 2019), https://www.nfl.com/news/ravens-break-single-season-team-rushing-record-0ap3000001092761 (nflverse play-by-play sums to 3,287, because a few plays are scored differently from the official totals); Lamar Jackson’s 1,206 rushing yards broke Michael Vick’s quarterback record of 1,039 (2006), and he was the second unanimous MVP after Tom Brady (2010), with all 50 first-place votes: CBS Sports, “NFL Honors: Lamar Jackson named unanimous 2019 NFL MVP,” https://www.cbssports.com/nfl/news/nfl-honors-lamar-jackson-named-unanimous-2019-nfl-mvp-after-breakout-year-for-ravens-quarterback . Divisional round, January 11, 2020: Titans 28, Ravens 12 (nflverse schedules; Baltimore’s early-down pass rate that night, 77%, from nflverse play-by-play, game 2019_19_TEN_BAL). Early-down ranks are a course calculation.↩︎

  9. Course calculation from nflverse play-by-play, 2021–2025 regular seasons, neutral situations between the offense’s own 20 and the opponent’s 30: the share of second-down and third-down snaps at each distance whose series ended in a first down or a touchdown (series_success, which counts fourth-down conversions too).↩︎

  10. Course calculation from nflverse play-by-play, 2021–2025 regular seasons, neutral situations, second-and-1 to second-and-3: pass attempts with 15 or more air yards (air_yards, recorded only for throws), against designed runs and shorter throws. Play-action shares from FTN charting (is_play_action), 2022–2025, via nflreadpy.↩︎

  11. Course calculation from nflverse play-by-play, 2021–2025 regular seasons, neutral situations: second downs whose previous snap, in the same drive, was the first-down play. “After a no-gain run” means the first-down play was a designed run and the distance is still 10. 1,332 and 4,179 snaps respectively.↩︎

  12. Noha Emara, David Owens, John Smith and Lisa Wilmer, “Serial Correlation in National Football League Play Calling and Its Effects on Outcomes,” Journal of Behavioral and Experimental Economics 69 (2017): 125–132, https://scholarship.haverford.edu/economics_facpubs/214 (working paper: https://mpra.ub.uni-muenchen.de/67862/). Using play-by-play from the 2000–2012 seasons, they found that NFL play-callers switch between runs and passes more often than an unpredictable caller would, and that the habit makes plays less effective.↩︎

  13. Zone names and boundaries differ from staff to staff; “backed up,” “coming out,” “open field,” “fringe” and “plus/minus territory” are common call-sheet and broadcast usage rather than rulebook terms. Coaches write field position as minus and plus yard lines (one backed-up objective in a clinic series with Steve Hauser: “avoid punting from the −1 to −4”: Aidan Grabowski, “Teach Tapes with Steve Hauser (Week 8): Walking the Field – Backed Up,” Coach and Coordinator, October 20, 2022, https://coachandcoordinator.com/?p=3907); some staffs call the deepest zone “coming off” (an indoor-football play-caller’s breakdown in Sports Illustrated, March 24, 2017, https://www.si.com/ifl/2017/03/24/salt-lake-screaming-eagles-playcalling-goalpost); and four-down territory is also called the “dead zone” or “no man’s land,” with boundaries set by the kicker’s range (“Dead zone (gridiron football),” Wikipedia, https://en.wikipedia.org/wiki/Dead_zone_%28gridiron_football%29). The 2025 kickoff touchback at the 35: NFL.com, “NFL owners vote to make dynamic kickoff permanent, adjust ball spot on touchbacks to 35-yard line” (2025), https://www.nfl.com/news/nfl-owners-vote-to-make-dynamic-kickoff-permanent-adjust-ball-spot-on-touchbacks-to-35-yard-line .↩︎

  14. Course calculation from nflverse play-by-play, 2025 regular season: the yard line of each drive’s first scrimmage snap. 66% of drives began at the offense’s own 25 or beyond (70% in 2024, when the end-zone touchback came out to the 30).↩︎

  15. Course calculation from nflverse play-by-play, 2016–2025 regular seasons, neutral situations: first-and-10 snaps by field zone; shotgun from the play-by-play shotgun flag; sack rate = sacks per dropback.↩︎

  16. NFL, Official Playing Rules (2026), Rule 8, Section 2, Article 1 (intentional grounding: a passer inside the tackle box may not throw an incomplete pass without a realistic chance of completion to avoid a loss of yardage; outside the box, the ball must reach the line of scrimmage; if the passer is in his own end zone, the penalty is a safety) and Rule 11, Section 5 (safety): https://operations.nfl.com/the-rules/nfl-rulebook/ . The chapter on officiating, 09-04, walks through the tackle-box rule with a backed-up diagram.↩︎

  17. Course calculation from nflverse play-by-play, 2021–2025 regular seasons: every punt, matched to the next run or pass in the same game; when that snap belonged to the other team, its yard line is where the opponent’s drive started (returns, touchbacks, penalties and the occasional block or muff included).↩︎

  18. Course calculation from nflverse play-by-play, 2025 regular season: fourth downs with 3 or fewer yards to go, outside the last two minutes of each half, counting runs and passes as “go for it” against punts and field-goal attempts.↩︎

  19. Ben Baldwin, nfl4th (open-source fourth-down decision model, R package and public app, 2020–): https://github.com/nflverse/nfl4th ; the package site, with Baldwin’s methodology and research notes: https://www.nfl4th.com/articles/4th-down-research.html . 10-04 uses the same model.↩︎

  20. Records, points and playoff results from nflverse schedules, checked against Pro Football Reference: https://www.pro-football-reference.com/teams/det/2023.htm and https://www.pro-football-reference.com/teams/det/2024.htm . NFC Championship, January 28, 2024: 49ers 34, Lions 31; divisional round, January 18, 2025: Commanders 45, Lions 31. Fourth-down attempts (all game states, runs and passes) and early-down ranks are a course calculation. Ben Johnson was Detroit’s offensive coordinator from 2022 to 2024 and became the Bears’ head coach in 2025 (see the course fact sheet).↩︎

  21. Course calculation from nflverse play-by-play, 2016 and 2025 regular seasons: field-goal attempts with a kick_distance of 50 yards or more, made or not (blocked kicks count as misses).↩︎